

Where are the Investment Mortgages?
Full interactive maps available to all in this post.

There are close to 2 million Investor mortgages in Fannie Mae and Freddie Mac MBS pools. This post provides granular maps showing where these mortgages are located. While I have thus far reserved the interactive heat maps for paid subscribers, today’s maps are available for everyone to enjoy/explore.
I am providing three maps today:
A map with all the GSE investor mortgages shown in it with the heat map shading based on percent of the census tract single family homes being GSE investor mortgages.
A map with GSE investor mortgages originated since June 2022 with the heat map shading based on the raw number of GSE investor mortgages originated in the census tract since June 2022
A map with GSE investor mortgages originated prior to June 2022 with the heat map shading based on the raw number of GSE investor mortgages originated in the census tract prior to June 2022
The first map provides a good overall view of investor mortgage hot spots. For example, Sieverville/Pigeon Forge, Tennessee stands out.

Mortgage Occupancy Fraud in Sieverville?
There are almost certainly more than 2 million GSE mortgages for investment purposes. Maybe just a few more, maybe alot more depending on how extensive occupancy fraud (claiming it as primary residence for cheaper financing, when the real intent is to rent it out) actually is. Whatever that number is it strikes me that they would distribute geographically in a pretty similar fashion to how the legit investor mortgages do.
Is there a ton of it in Sieverville? Probably not, there is just not all that much room for it. The spreadsheet below shows the FNMA and FHLMC mortgages for the 19 census tracts I am treating as the Sieverville area. (The scaling multiplies the raw number which I know the census tract of the mortgage to the whole portfolio assuming a similar distribution for the mortgages I cannot link to HMDA and thus know the census tract.)

When you add it up in Sieverville
GSE Investment Mortgages: 2710
GSE Second Home Mortgages: 2917
GSE Primary Home Mortgages: 2715
Given that AirDNA lists 14,000 short term rentals in the Sieverville area (unsure their exact geographic boundaries)

it seems likely many of the second home mortgages are probably renting it when they are not using it (dunno if this would actually constitute occupancy fraud) and Im sure some chunk of the Primary home mortgages are too, but mostly, this area just has a wildly (relative to most areas) disproportionate mix of investment and second homes vs. Primary home mortgages.
But maybe its all in FHA mortgages?

Again probably not too much of it. There are only roughly 1,000 FHA mortgages over the same set of census tracts and the real hot spot of second home and investment mortgages for GSEs (tracts 47155080901, 47155080904 and 47155081101) contain just 60 FHA mortgages. You can decide for yourself but it doesnt look rampant to me.
Investment Mortgages Before and After June 2022
The second and third map allow you to identify where recently originated (June 2022 until now) investor mortgages have concentrated. Why might this be interesting? Those recent mortgages will carry considerably higher rates, tend to have higher property taxes and just generally be higher loan amounts. How much that impacts the investment properties profitability (and thus a potential impetus to sell the investment) versus other factors I am not sure but its not too difficult for me to breakout the data/maps this way so I thought I would.
The shading on the pre and post June 2022 maps is based on raw mortgage count. So census tract 108.18 in Chatham County Georgia saw 7-13 GSE investment mortgages originated prior to June 2022
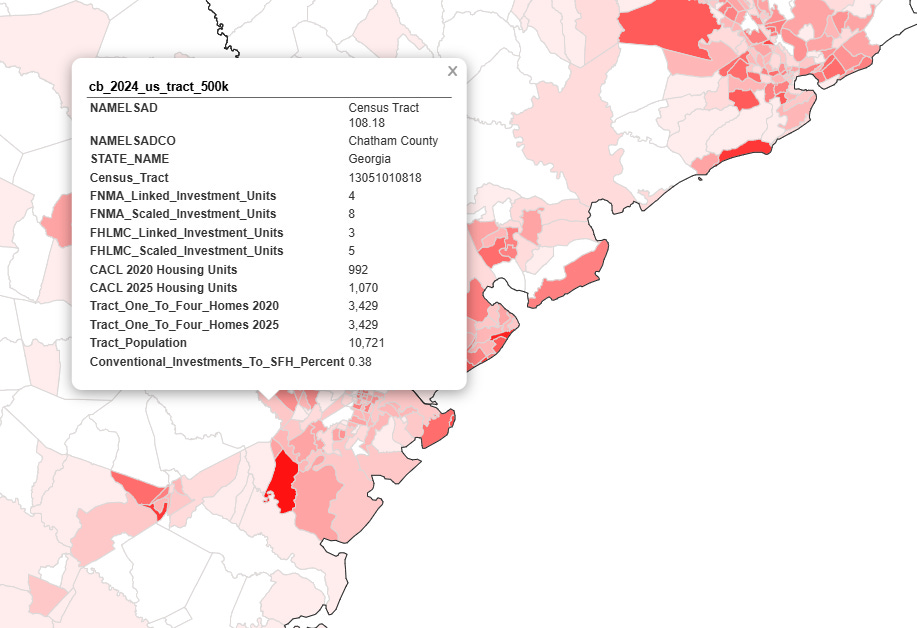
and 59-72 GSE investment mortgages originated since June 2022. Why the recent spike in this particular tract? I dont know. Perhaps a reader will.

Opening the Interactive Heat Maps
There are 3 zip files at the following link. Each zip file contains an index.html file along with various folders of supporting file. Unzip the file and open the index.html file in your browser of choice (Definitely works in Edge, should work in any of them).
From there pan around the map to investigate areas of interest to you. To see the data for any particular census tract left click on it and the data will pop up. The maps span the entire country (save Connecticut since their census tracts all changed last year, something I am in the process of building a fix for)
Link to the Investor Mortgages Heat Maps
https://drive.google.com/drive/folders/1z8EKyyvMpZUVqY1OOheTRJCM_Ve5feKH?usp=sharing
If you enjoy/ it is valuable to you to see mortgage data broken out this way, please consider purchasing a subscription. You will have access to all such maps I have put together and will continue to put together as new data rolls in, and if you have ideas on specific maps you would like to see, please let me know.
June MBS Data will be out in the next day or two. Further updates then.
Thanks,
John
PS For more on Sieverville, please see Melody Wright’s most recent post:

Is it possible to add in Non-QM DSCR loans to this analysis? Also agency eligible investment property loans that are sold away from GSEs.
Have been seeing more of that post 2022, which coicides with the (temporary) GSE NOO delivery caps.
Fascinating work, John.