Treasury Model Mid-August Update

The TGA rebuild is tracking close to what my Total Treasury Model has projected. This update contains a couple tweaks to withdrawal categories and a small tweak to bill issuance expectations. Nothing major. Updated daily projections for TGA level, withdrawals, deposits and debt issuance/redemption are as always at the end of the post for paid subscribers. If you want to track the TTMs projections of daily withholding receipts, you can do it. Any category for that matter.
TTM performance in August so far
Through the 18th of August, the TGA portion of the Total Treasury Model has net underestimated TGA receipts by $2.6 billion dollars (a bit more than 1% off on $231 billion received thus far in August). The TTM has net overestimated withdrawals by $9.1b (a bit more than 2% off on $431 billion spent thus far in August) for a combined over estimation of the August deficit of ~$12b. Not amazing performance, but not terrible either.
Receipts
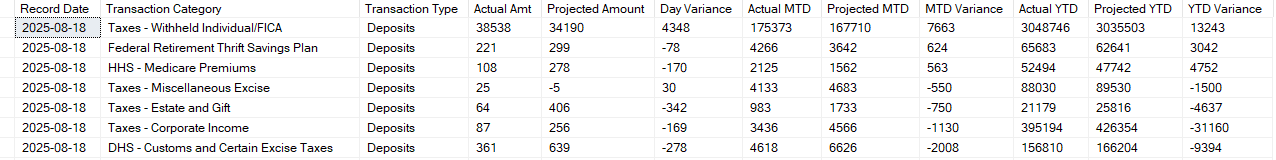
The receipts variance is largely due to a $7.6b under projection of withholding receipts offset by ~3.1b total over projection of corporate tax receipts and DHS - Customs and Certain Excise Taxes (aka tariffs).
Three things to take from this:
Withholding continues to slightly outperform the consistent growth trend over the last 3+ years. Historically August has almost no withholding noise/variability from bonus payments, IRA required minimum distributions or vesting restricted stock units, so unless something has changed that I am unaware of, the strong withholding receipts are suggestive of at least solid payrolls. This somewhat stands in contrast to the most recent NFP and revisions, an important counter datapoint to consider I think (see the end of the article for a more detailed breakdown of how I project monthly/daily withholding receipts)
Tariff revenue is coming in lighter than expected so far this month. To be sure. most of the DHS - Customs and Certain Excise Taxes receipts come in on a single day (around the 22nd or so) but the earlier days in the month have been highly indicative of what the big day receipts will look like in recent months so I would be surprised if tariff revenue doesnt end up down some in August compared to July. I expect I will need to adjust future expectations for this category in September but Im not ready to pull the trigger on that yet.
Its tough to say for certain since August is such a light month for them with no collection dates, but Corporate income tax receipts seem to be feeling even more impact from the OBBB than I thought they would. I reduced my expectations for the category by about 13% vs. pre-OBBB, looks like I may need to do it some more come September.
Withdrawals
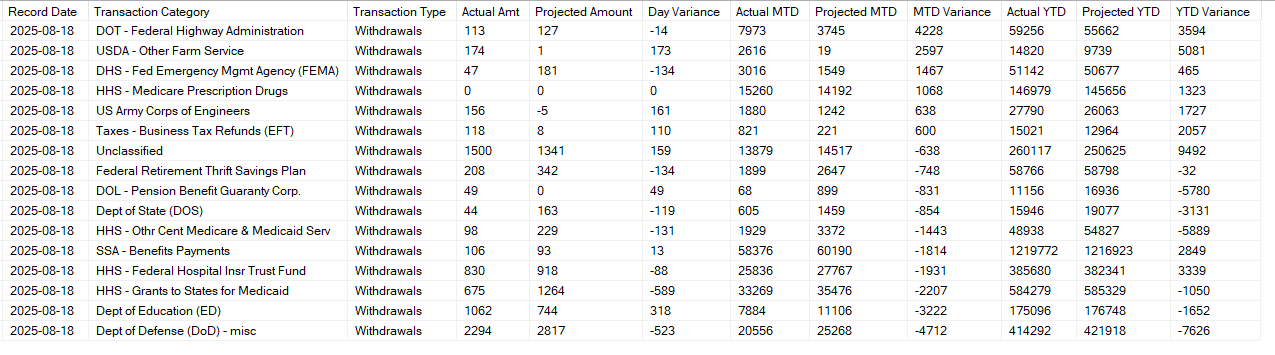
DoD - Misc: I upped expectations for the category after July due to the OBBB, think I overdid it, so paring back the increase a touch and will reevaluate in September.
Dept of Education Withdrawals: Through the first of February this category was outlaying at the same rate it was last fiscal year. Since the administration change though it has been outlaying at 70% the pace of the year before. I updated the model in the spring to reflect this slower pace of withdrawals and am updating it again to slow it some more with the OBBB reductions in what students can borrow.
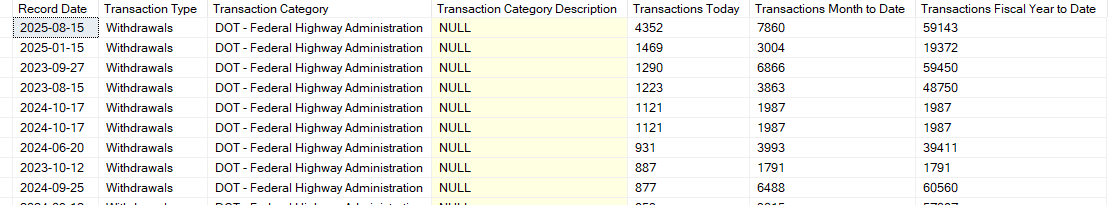
Federal Highway Administration: On Aug 15th this category outlayed 4.352b, ~ triple the previous largest daily outlay of 1.469b. I thought maybe the OBBB contained some highway spending I was unaware of but couldn’t find anything. Accordingly I am treating it as an anomaly and not adjusting future expectations for the category. Bit hey if anyone knows what this spend was for Id love to know.
USDA - Other Farm Service: This category has seen a surge this calendar year due to the American Relief Act last December. I had these additional expenditures tapering off to quickly and am adjusting the category through the end of the fiscal year. I also have it elevated vs, previous year norms in FY26 assuming some of the actual outlays will extend into FY 26.
How the TTM projects daily Withholding
The TTM projects daily withholding numbers by first determining a withholding number for the month and then distributing that monthly number over the days the TGA is open (business days less holidays) of the month.
Months vary with how many business days they contain. Every month contains a core 20. Most months contain extra business days. For example, this August contains 21. The core 20 plus an extra Friday.

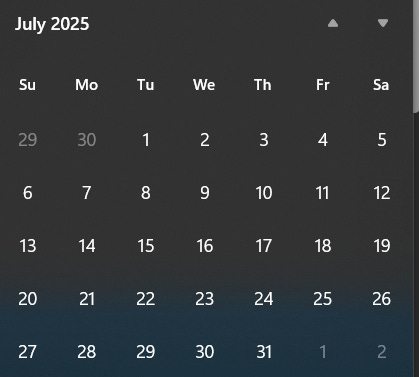
July contained 23, the core 20 plus an extra Thursday, Wednesday and Tuesday.
The TTM determines the expected withholding from the core 20 business days by starting with the core 20 value from July 2022, adding the expected withholding for the “extra” days of the month (each weekday has its own value) and then applying a compounded monthly growth rate of 1.0042 (which comes out to about 5.2% annual growth rate). For some months (August and July for example) thats it. December through April however, will see larger numbers due to a variety of factors, withholding on bonuses, withholding on vesting restricted stock units, taxes on IRA required minimum distributions which flow into the TGA via the withholding category. Thus each month gets a bonus multiplier and I will tweak/adjust those a little to match actuals. Each month has a historically typical range for that multiplier though so I dont have to play with the multiplier too much to keep the projections tracking close to actuals.
The bonus multiplier for July and August though is 1. There has just not historically been almost any bonus etc. noise in the withholding data. Perhaps that changed this summer. Im skeptical,
Intramonth distribution is done using historical distribution patterns based on week day, calendar day of the month, business day of the month, and proximity to holidays. The algorithm works sort of shockingly well and is why my daily projections of withholding receipts are very close to what Treasury actually reports. But hey dont take my word for it. Follow along using the attached model data.
Bill Issuance