

Reverse Engineering the RRP
RRP unlikely to drain this year

Greetings!
Since late last summer I have off and on been trying to develop a reasonably accurate model for projecting the daily RRP uptake. I haven’t fully succeeded, but Ive reached a point of accepting that I just don’t have enough information available to me to succeed to a degree that say the Total Treasury Model has at predicting the level of the TGA each day. On the other hand, while I cant project the RRP precisely most days, there are a number of patterns in its uptake that allow one to get a general idea of whether and roughly how much it will fall/rise. This post will detail them and provide a framework for how to think of RRP uptake and what guides it. It will also offer my take on where the RRP goes this year. This post will also introduce a new dataset Ive developed; a detailed look at what each RRP counterparty MMF is buying of new t-bill issues each month as well as any sales or buys of off the run bills by those funds.
The shoes of an RRP Counterparty MMF manager
RRP uptake is dominated by MMFs, with GSEs Fannie Mae and Freddie Mac currently using it a bit each month as well. In theory its available to banks, but in a world where interest on reserve balances pays 10bp more than the RRP rate, banks do not use it. Accordingly, I think the right framework to understand RRP uptake each day is to put yourself in the shoes of an MMF manager. Every day at around 1pm EST you have to make a decision, how much of yesterday’s RRP uptake do you rollover for another day and if the answer is all of it, then how much, if any, of the deposits in the MMFs commercial bank account do you want to add to the RRP uptake. On the other hand, if the answer is you only want to rollover some of yesterday’s RRP uptake then you will get back what was not rolled over as deposits in the MMF’s commercial bank account at 3:30pm. Its basically as simple as that daily choice being made by the 103 managers of MMFs that are setup as counterparties to the RRP (though these days its only 70 or so of them who regularly still have daily uptake). So what factors in to your decision as that MMF manager?
I think It mostly boils down to a question of how much cash (in the MMFs commercial bank account) do you have at that point in the day. How much cash do you expect to come in through the end of the day (money from new investors, money from last nights private repos that didn’t rollover in the morning, unsettled asset redemptions etc.) and how much cash outflow you will need to manage through the end of the day (share redemption requests, settling any unsettled asset purchases etc.). Investor cash inflows and outflows aside, you control the cashflows related to assets you might invest in (cash out to purchase them, cash in when they redeem). So as a starting point, what assets can you invest in?
The vast majority of RRP Counterparty MMF assets under management (~80%) are held in Govt. MMFs.. Govt. MMF managers have limited places to put cash managed by the fund. Those investment options are:
1. Treasury bills (or FRNS or off the run treasury notes/bonds maturing within a year)
2. Agency Debt which as a practical matter is almost entirely FHLB debt
3. Private Repo with Agency MBS or Treasuries as collateral
4. Public Repo with the Fed (aka the RRP)
5. Deposits in a commercial bank account
Treasury Bills
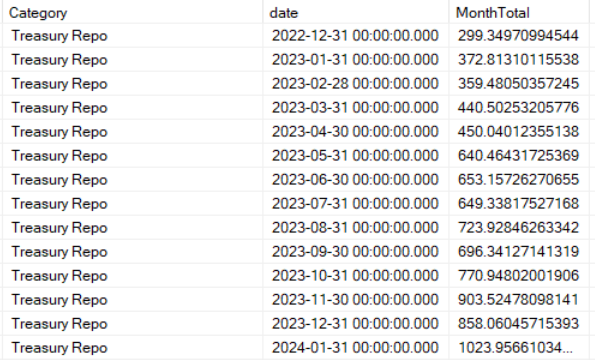
T-bills are usually a good option for MMF managers. The counterparty is solid (no counterparty risk limits with the US Treasury), an MMF can sell them intraday for cash (instead of waiting until 3:30 to get back last nights RRP or private repo) if they need it to meet unexpected redemptions, they count as daily and weekly liquid assets to help keep those ratios high and often there is a yield pickup over RRP. Of course that yield pickup cant just be measured against the RRP rate at the time the bill is purchased, rather it needs to be measured against the MMFs view on where the RRP is going over the tenor of the bill. So if the MMF thinks a 25bp cut is coming at the next two FOMC meetings but then steady after that, they would factor that into the price they view as attractive for a 26 week bill that’s being issued, which would likely be an investment rate on the bill that’s lower than the RRP on the day they bought the bill. In a hiking cycle, the opposite is true. Its not much of a surprise that MMFs had such little appetite for bills in late 2022 through the first half of 2023, even as inflows were starting to increase MMFs net assets. Some of it was surely due to fewer bills issued (2022 bumper tax receipts and then the debt ceiling impasse) and thus bills being relatively more valued than they otherwise would be, but generally MMFs did better just sitting in RRP and riding it up. Grid below shows the Treasury debt held by the RRP counterparty MMFs since March 2021. Technically its not all bills, there are some FRNs and coupons with little time left to maturity, but its mostly bills.

But as the market started to perceive that the hiking cycle was over and as an epic flood of bills was issued since the debt ceiling resolution (pushing down on their price and up on their yield) MMFs have bought in earnest.
There is of course some duration risk in bills, not much but not literally none. For the vast majority of bills MMFs buy, they buy them, hold them, and redeem them when they mature. Occasionally though, unexpected large redemption requests materialize (or expected inflows/new shares don’t) and if the MMF doesn’t have enough cash in its commercial bank account to cover it might have to sell a bill and potentially realize a loss if the bill has declined in value due to recent interest rate hikes. Its not much risk but with govt MMFs being allowed to fix their NAV, the govt MMF rules mitigate that risk by binding the MMFS to a Weighted Average Maturity across their portfolio of 60 days or less.
In recent months, MMFs have been extending out their WAM to lock in better return with longer tenor bills in the expectation of rate cuts. Compare the WAMS of the top 25 (by RRP usage) MMFs in January 23 vs January 24


But there are limits to that activity and unless the fund sizes continue to grow (MMF inflow) there is an upper limit to the amount of longer tenor bills the MMFs can continue to buy enforced by the WAM less than 60 days rule.
So in sum, particularly now that there is generally a market expectation of rate cuts ahead (albeit fewer than expected a few weeks ago), longer tenor bills have presented a more attractive holding proposition vs. RRP and funds have bought accordingly.
Agency Debt
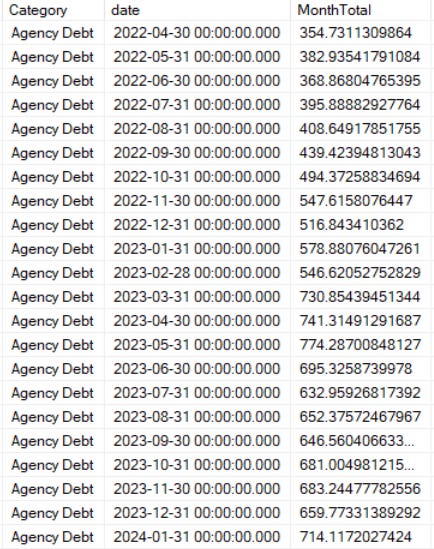
Agency Debt which is dominated by FHLB debt takes a variety of forms, including Discount Notes which resemble treasury bills and fixed rate bonds that are within a year of maturity (so the above bill analysis including WAM effects effectively applies to them as well), but the significant majority of what MMFs hold of FHLB debt (422b vs. 291b on 1/31/24) has some sort of floating rate that resets daily based on SOFR. That latter debt will almost always be a better choice for an MMF vs. RRP uptake. Pickup in yield, effectively the same counterparty (US govt), same impact to WAM, more liquid intraday in a pinch. Accordingly, large surges in the supply of this debt can cause MMFs to reduce RRP uptake in favor of purchasing it. Indeed we saw just that in March of 2023 when SVB etc. caused a surge in regional banks securing funding via FHLB advances and the FHLB funding that funding by a surge in debt issuance, happily bought up by RRP counterparty MMFs. From 2/28/2023 to 3/31/2023, Floating agency debt held by those MMFs spiked from 337b to 470b (fixed rate agency debt rose from 210b to 261b).

The result on the RRP? Uptake still rose by 132b, but for a month that saw MMF inflows of 256b and MMF reductions to their treasury debt (reduced bill issuance due to DC impasse) of 87b, and 90b of prime RRP counterparty MMFs reductions to time deposits, commercial paper etc only offset by increases to Treasury and Agency repo of 45b and 81b. Bottom line, without the 184b increase in agency debt that month, the RRP would have likely added another 100-200 than it did that month. Agency Debt supply can make a sizeable difference on RRP uptake.
Private Repo
Private Repo is also a solid option for MMF managers vs. RRP. It usually offers the benefit of a slight bit more yield, but even at an equivalent yield there are relationship benefits to MMFs to lend to dealers that need the cash. It offers the same WAM benefit that the RRP does, provides the same collateral, and is subject to the same intraday liquidity constraints (money lent overnight last night is returned at 3:30pm if not renewed) as the RRP. The drawback vs. the RRP is the counterparty risk. Theres none of it with the Fed and there is at least a small bit with the dealers borrowing from the MMFs. Accordingly, there are typically limits to the amount of private repo an MMF may perform with any given counterparty. In sum, structural rises in the market need for funding through repo will structurally shrink the RRP and vice versa. The same holds true for temporary rises. For example it is no coincidence that settlement days for long duration treasuries usually correspond to declines in daily RRP uptake. Dealers need to temporarily fund the Treasuries they have bought at auction until they can be disbursed to end holders. The following days usually then give that back to the RRP.
RRP counterparty MMFs are lending a good bit more to private repo then they were a year ago. Whatever the cause, (basis trade, MREITs relevering?) it pulls money from the RRP. Accordingly, when thinking long term about where the RRP uptake will go, its a factor to consider.

Commercial Bank Deposits
OK, so this isn’t really an investment choice for an MMF as much as it is the remainder of the MMFs management of its cash flows/liquidity. Its where the money from new investment (NAV shares created) and redemptions (NAV shares redeemed) goes to and comes from. Its where the money from redeeming bills goes to and where the money to purchase new bills comes from etc. This may seem obvious to many, but Ive included it because if it wasn’t obvious to you than it’s a key concept to understanding the mechanics behind an MMF. It usually amounts to 1.5 to 2% of an MMFs holdings on any given day.

As mentioned earlier If the MMF is a prime MMF, more options open up like
1. Time deposits/Certificates of Deposits with foreign banks
2. Financial and non-financial company as well as commercial paper
But the prime funds only represented ~132b of the 582b MMF RRP uptake on ‘1/31/24’ and while the prime funds have additional investment options for their cash, they still put much of it in the 6 govt MMF allowable asset categories, so Ill keep discussion limited to its effect in March 2023.
Daily RRP movements
On any given day, that MMF manager is making allocation decisions based on the net inflow/outflow expected for the day, what assets are redeeming, what assets are available for purchase (new treasury supply, new FHLB debt supply etc.), repo market needs for cash etc. Unfortunately, in the absence of day level asset positions of all the RRP Counterparty MMFs, there is only so much one can do to identify the patterns. With the TGA, as complex as modeling all the underlying withdrawal and deposit flows can be, there is a lot of daily past data to model off of. With the MMF data there just isn’t (at least not publicly available, maybe ICI has it, don’t know). A few MMFs publish their detailed asset holdings daily and a few more weekly, but most publish them just once a month when they are regulatorily required to. Fortunately the SEC makes those filings (NMFP) publicly available. From those cusip level asset holdings each month you can derive a surprising amount of information that implies daily activity, but only really for treasury debt and agency debt. I know of no way to know the daily repo lending of MMFs outside of month end.
Undeterred though, there are general daily patterns that emerge.
1. Tuesday and Thursday bill settlements. Each Tuesday and Thursday MMFs both have bills that are redeeming and need to settle bills they purchased at auction a few days earlier. These days, as MMFs have been increasing the number of bills they hold, Tuesdays and Thursdays usually result in less RRP uptake as MMFs use cash in the RRP to fund the difference between what they bought and what matured that day. The effect is heavier in recent months on Thursdays because that is when the longer tenors (13w, 26w, and occasionally the 52w) settle.
2. Coupon Settlement days. The 15th and the end of the month, which push down on RRP uptake in favor of cash lent to dealers in repo. The effect is more pronounced with the midmonth securities I presume because more duration is settled mid month (10s/30s) vs. end of month (20s).
There are also two other distinct patterns that often mask the effects listed above
3. GSE Money. Every month, servicers of mortgages in FNMA and FHLMC MBS collect mortgage payments from the underlying borrowers and then forward it on to the GSEs so investors can get paid. For mortgage payments due from borrowers on the 1st of the month, the servicers are required to remit it to the GSEs by the 18th of the month (or preceding business day). Since the GSEs cannot earn interest on their reserve balances at the Fed, they either lend that money in private repo (crowding out MMF money to private repo) or they stick it in the RRP directly. Readers familiar with my monthly QT posts will know that the GSE payments to MBS investors (including the Fed) happen on the 25th of the month, so the temporary money that come in on the 18th/19th, leaves again around the 25th. Detailed RRP uptake from the 4th qtr of 2021 (Fed posts detailed activity 2 years later) shows the effect.

4. There is also a very notable month end pattern of a rise in RRP on the last day of the month and reversing on the first day of the next month. Its most pronounced on qtr ends and particularly on year end, but its present to some degree every month end. The root cause behind it is that foreign banks reduce leverage on month and quarter end regulatory reporting days. Bank dealers borrowing less those days leads to higher usage of RRP. But since the month end days are “snapshot” days, the effect reverses at the start of the next month.
Path of the RRP from here
Its important to note that effects 2, 3, and 4 from above are transient effects. They don’t really effect the long term rise or fall of the RRP. Neither really does the fact that bills settle and mature on Tuesdays and Thursdays. There are five main structural influences to the level of RRP uptake
1. The overall level of bank reserves in the banking sector and to a degree the distribution of those reserves. As some banks start to get scarce on reserves required to comfortably meet their intraday resolution liquidity requirements, they will likely borrow advances from the FHLB which in turn will issue debt to fund it which will be bought by MMFs probably at the expense of the RRP. So QT, which drains bank reserves by forcing Treasury to issue 60b more a month, which is paid for in bank reserves which are then transferred to (and destroyed by) the Fed in exchange for maturing securities, will tend to push down on RRP and would eventually cause it to go to zero. But how much of a push really depends on what LCLOR is combined with how well those reserves are distributed amongst all the banks. More unevenness in the distribution of those reserves pushes harder down on the RRP as QT continues. Similarly, temporary spikes in the TGA, particularly the large upcoming spike in April where tax receipts will likely push the TGA close to 1.1T, could temporarily push down on the RRP depending on where the reserves to pay the taxes source from.
2. MMF Inflow/Outflow. The more money shifts from bank deposits to MMFs the more cash that MMFs need to allocate somewhere and all else equal, more RRP uptake. The reverse is also true.
3. The composition of Treasury issuance. Continued growth in bill supply by the Treasury tends to cheapen bills (thus higher yields) making them more attractive vs. RRP even accounting for mkt expectations of the RRP rates future path. The reverse is also true.
4. Market expectations of cuts or hikes to come. The more MMFs anticipate imminent rate cuts, the more likely they are to increase their WAM and buy longer tenor bills. The reverse is also true.
5. Structural rise or fall in the demand for repo financing. Will the basis trade continue to grow or will the recent scrutiny cause it to shrink? Will MREITs lever up or down? I am not sure in either case but changes in that demand will impact RRP uptake.
So whats my take on how long the RRP hangs around? Well, here is my analysis of the structural factors through the end of year.
1. Assuming no taper, from 1/31/24 thru 12/31/24 there will be ~793b in balance sheet reduction (60UST/m x 11 months) – 67b (missed UST caps in June/Sep/Dec) + ~200 MBS QT (18/m x 11 months)
Subtracting that 793b from the 4026b in bank reserves + RRP on 1/31/24 yields 4026b – 793b = 3233b that must be split between RRP and bank reserves at the end of the year.
Does a bank reserves level around 3T imply regional banks scrambling to the FHLB to secure enough intraday liquidity? It may have in the past, but the data implies to me that it has already happened to some extent.
For example, in late April 2022, bank reserves were at 3327b

In late January 2024, they were 3411b
But over that same time period, RRP counterparty MMF holdings of FHLB debt (a not perfect, but pretty good proxy for total FHLB debt and thus advances) grew from 355b to 714b
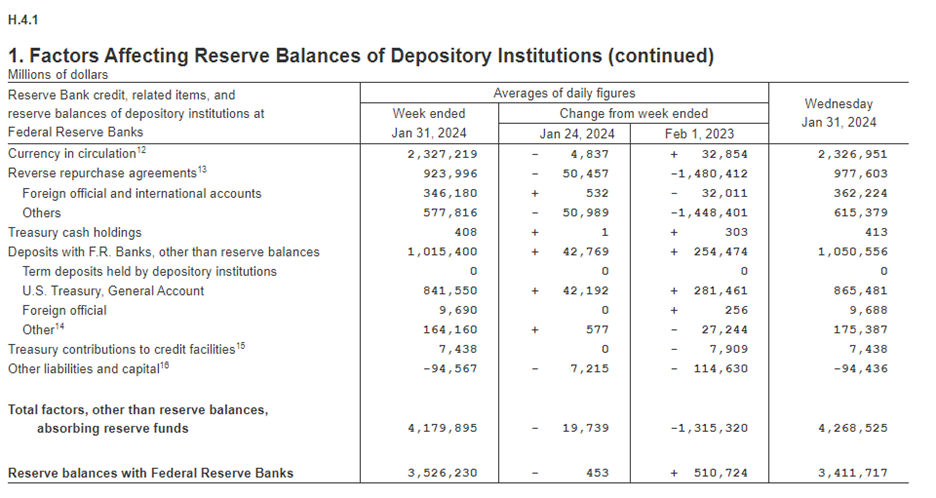
Now perhaps this just reflects regionals need to address deposit flight that already happened, and Im sure that explains some of it, but I think there was also a significant amount of effort by Regionals to term out their liquidity thru advances and I think the recent drops in the deposit rates offered at a number of Regionals reinforce this idea. Eventually, the total level of bank reserves will drop low enough to further force reserve scarce regionals to significantly hit up the FHLB (driving the RRP down) but I don’t think it happens this year even if there is no additional taper of QT above what will naturally occur. (RRP H4L)
2. Less market expectation of rate cuts and regionals cutting deposit rates is unlikely to reverse MMF inflows to outflow. So I suppose my base case is that MMF inflows/outflows level in the aggregate thru the end of the year. (RRP H4L)
3. Running the Total Treasury Model through the end of the year generates the following estimated Net new bills thru end of year. (the numbers through 6/30 align with the QRA numbers, beyond that it requires trust in the models ability to accurately project deposit and withdrawal flows, it wont be perfect and the accuracy will tail off the later we go but considering how the model performed at estimating the borrowing needs for the Jan QRA I think its likely to be in the ballpark)
1/31 -> 3/31 = +317b
3/31 -> 6/30 = -338b
6/30 -> 9/30 = +547b
9/30 -> 11/30 = +358b
11/30 -> 12/31 = -231b
Total ~665b from 1/31 -> 12/31
Applying ~75% absorbance of net new bills by RRP counterparty MMFs (tracking their rate of absorbance of net new bills from 7/31/23 -> 1/31/24) and MMFs would absorb 490 of the 653b net new bills by end of year. (and of course if MMF total assets stay level and bills increase, something must decrease, most likely the RRP) In aggregate across the funds, there should be enough room in WAM for MMFs to absorb these bills, but as some funds get tight on their WAM (60d) and some funds just seem to not want to extend their WAM much for whatever reasons, its probably reasonable to assume the bill absorption wont be quite as much, so maybe only 400-450b of them, leaving room for RRP to still have some uptake in December 24 (all other assets FHLB, repo etc., and total asset levels being equal), though at a low level.
4. MMFs may not have quite the appetite to extend WAM given the new outlook on fewer rate cuts and even some risk of rate hikes (low though it might be) creeping back into the picture. So the expectation of a continued 75% absorbance of net new bills by RRP counterparty MMFs may well be too high as described above. (RRP H4L)
5. The wild card. I think Agency Repo demand levels pulls back a little with the revised market expectation of fewer rate cuts. As for Treasury Repo demand? I also think it levels or pulls back a little. I think the increased “scrutiny” on the basis trade militates against it continuing to grow beyond where it is now. So all in all (RRP H4L)
I think there is some possibility that the RRP gets very close to zero in late November. I specifically broke out the net new bills in the 4th qtr for Oct and Nov vs. Dec to highlight this. The Total Treasury Model predicts a large surplus for December 2024 due to seasonal Witholding flows (both holiday bonuses and IRA RMD flows) and corporate tax collection, in combination with calendar effects (most of end of month November coupon settlements hit 12/2, but December end of month coupon settlements hit 12/31) will mean a significant reduction in bills over the month. Its entirely possible that the RRP may sniff zero late November before rising again in December and hanging around until late February/March of 2025 when it will likely flatline for good.
Munging all the factors together Ill call my shot of 150b of RRP uptake on December 27th. Why the 27th? Because Im trying to make a structural projection here and The 31st has the largest transient effect on RRP involved (the window dressing at the Turn) so I don’t want it in play. Honestly though, its way less about a specific projection than it is about explaining the various things that impact the RRP.
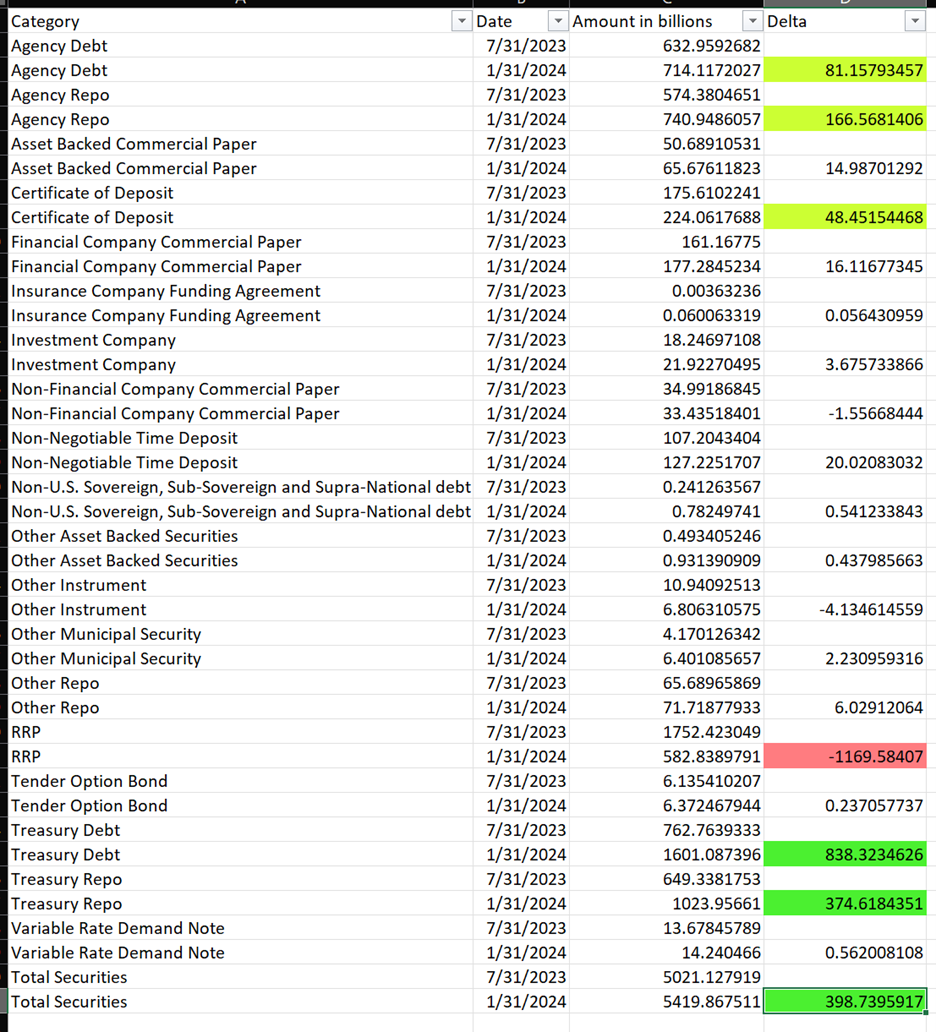
To reinforce that point, the following image shows the change from 7/31/2023 to 1/31/2024 for the various asset categories across the RRP counterparty MMFs. The significant increases are shown in green, declines shown in red. It has to be a holistic analysis.
Detailed RRP Counterparty MMF Dataset
The MMF data presented in this article all comes from the month end NMFP filings that MMF must make with the SEC which amongst other information, details their assets holdings at literally a CUSIP level. Every month around the 7/8th of the month when the filings are all in, I download them, parse them into a database and perform a variety of data transforms to normalize the data (you would be surprised how many different character strings can be used to describe the Federal Reserve Bank of New York as a Treasury Repo counterparty (RRP)). I do this for the 103 MMFs that are setup as counterparties to the RRP. Last summer, nearly all had some uptake each month. In January its down to around 70 but I keep up the dataset inclusive of the holdings of the MMFs that are not currently uptaking for both continuity of the data and because those MMFs could absolutely decide to allocate back to RRP if the circumstances favored it. The funds include both prime and govt MMFs, institutional and retail. These 103 funds aren’t the entirety of the MMF complex but at 5.4T net assets on January 31, they represent well more than most of the total assets held by MMFs.
With the detailed monthly asset holdings of all of these MMFs dating back to January 2020, I am further able to slice and dice the data to suss out interesting pieces of information. One such piece of information is the precise bills that each of the MMFs is buying each Tuesday and Thursday during a month as well as the amount of maturing bills each MMF has on those Tuesdays and Thursdays. For example, in the aggregate in January the RRP counterparty MMFs bought the following bills.

The second column describes the total bills maturing for the RRP Counterparty MMFs on that particular day. The third column describes the amount of bills of the particular tenor that was originally bought in the past that was set to mature on that date. You might notice a data peculiarity for the 4-Week and 8-Week bills maturing on 1/2/2024. The 42.8b number is split in some measure between the 4-Week and 8-Week tenors. Unfortunately, its impossible to know give that the 8-Week bill both auctioned and issued in November and the 4-Week bill auctioned in November though it issued in December. When a bill is auctioned in a prior month but issues in the next month, the amount MMFs buy will be listed as an asset in the prior months NMFP filings, even though the bill hasn’t issued yet (they are sometimes listed as WI – When Issued in the NMFP asset descriptions). In most cases my algorithm is able to correctly attribute WI bills from a prior month to the issued bill the next month, but when an 8w (auctioned and issued) and a 4w (auctioned) happen in the same month it cant, so it just attributes all of it to the earlier bill. The rest of the “Originally Bought” values should be correct.
You might also notice that the sum of the “Originally Bought” bills does not equal, indeed usually exceeds, the total amount of bills maturing for that day. This is due to MMFs tweaking their portfolio of bills occasionally. For the most part, MMFs seem to buy, hold and redeem bills, but its not 100%. Below are the aggregate MMF tweaks done during the month of January to bills maturing after January

I plan to start publishing this dataset, in addition to the latest daily TGA projections of the Total Treasury Model through the end of the year in paid subscriber posts starting in early March. I intend to keep posts like these that provide analysis on top of that data free, but I also want to provide an opportunity to have and evaluate the data I generate to folks who want it as well as provide an outlet for those who care more about the analysis but want to support the work I am doing to do so. The Total Treasury Model and the scripts/algorithms to transform the raw NMFP data into a useful fund level look at what bills (and eventually FHLB assets, and repo counterparties) they are buying and occasionally selling each month represents a ton of work to produce and a not insignificant amount of work to maintain and update each month.
Anyways, as always thanks for reading.
John
Impressive work again!
always a pleasure read your posts, God bless you