
I do not know when Congress will raise or suspend the debt ceiling or what the contours of that eventual deal will look like. What I do know, is they have plenty of time to strike that deal. Unlike 2023, the X-date will not be in June but rather in August. I currently project it to be August 21st. but any date from the 15th on looks vulnerable
Putting the likelihood of June in perspective:
The following table compares the setup this year vs. 2023. Barring some black swan, there is little risk for June. I model the closest approach in June on June 12 and that date has a combined amount of TGA and remaining borrowing headroom of 223b.
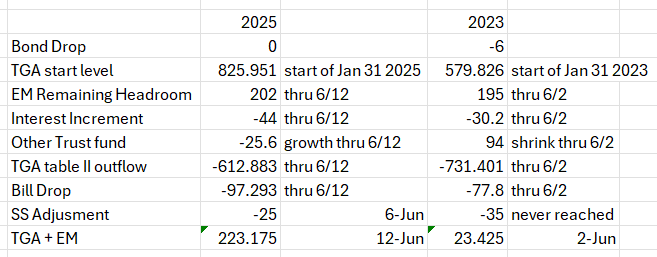
The key differences this year vs. 2023 are
Much higher TGA level to start with (pushes out the X-date)
Less deficit spending outflow due to higher April tax receipts due to a bumper crop of capital gains taxes incoming and LA fires way less impactful on delaying receipts than 2023 California floods. (pushes out the X-date).
More govt/trust fund growth vs. 2023 (bring in the X-date)
Its possible I am over-estimating the April tax receipts and thus underestimating the deficit outflow through June, but it would have to be by quite a lot to bring June into play. Also note that the -613b estimate does not include revenue from the new tariffs announced Saturday. Using the tax foundations estimate of 111.4b impact for 2025 translates to 40-50b more revenue before June. The -623b estimate also still includes USAID withdrawals, about 7b between now and June. If the tariffs stick and the USAID withdrawals dont shift to another TGA category, June is even safer and likely pushes the X-date to the very back of August. We will find out Treasury’s view on it Monday afternoon with the QRA’s financing need, or maybe we will, its tough to know if Treasury will include tariff revenue in their estimates since they wont yet be in place (they go live the next day).
The remainder of this post describes in detail all the various factors that add up to being able to project the X-date. It assumes some readers may be entirely new to debt ceiling mechanics and the Daily Treasury Statement so it starts basic and gets progressively more complex. All the the assumptions I have made and configured into the Total Treasury Model to add extraordinary measures and intragovernmental holdings/govt trust fund are presented.
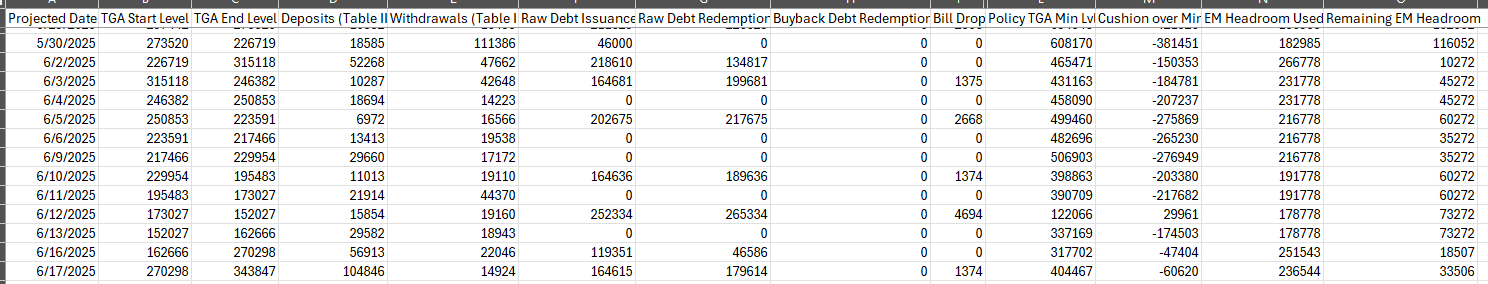
It concludes for paid subscribers with the model output detailing the projected TGA level for each day through the end of August. Here is a sample of that output for the close encounter in June.
If you benefit from or want to support my work please consider becoming a paid subscriber. As it is my primary source of income, that support enables me to do this and not return to the w-2 world and as such I hugely appreciate it.
TGA and Daily Treasury Statement Basics
The US Govt has one giant checking account, the Treasury General Account (“TGA”), managed by the Treasury. Similar to managing a household checking account there are daily bills to pay (defense contractors, federal salaries, social security checks etc.) and there is daily income into that account (tax receipts, folks buying stamps at the post office etc.). That account keeps a running balance which updates daily with the difference between those withdrawals and deposits. Non-debt TGA deposits and withdrawals are reported daily (with a one day delay) in Table II of Daily Treasury Statement (“DTS”) available here. (https://fiscaldata.treasury.gov/datasets/daily-treasury-statement/deposits-and-withdrawals-of-operating-cash).
From the DTS for Oct 15th 2024
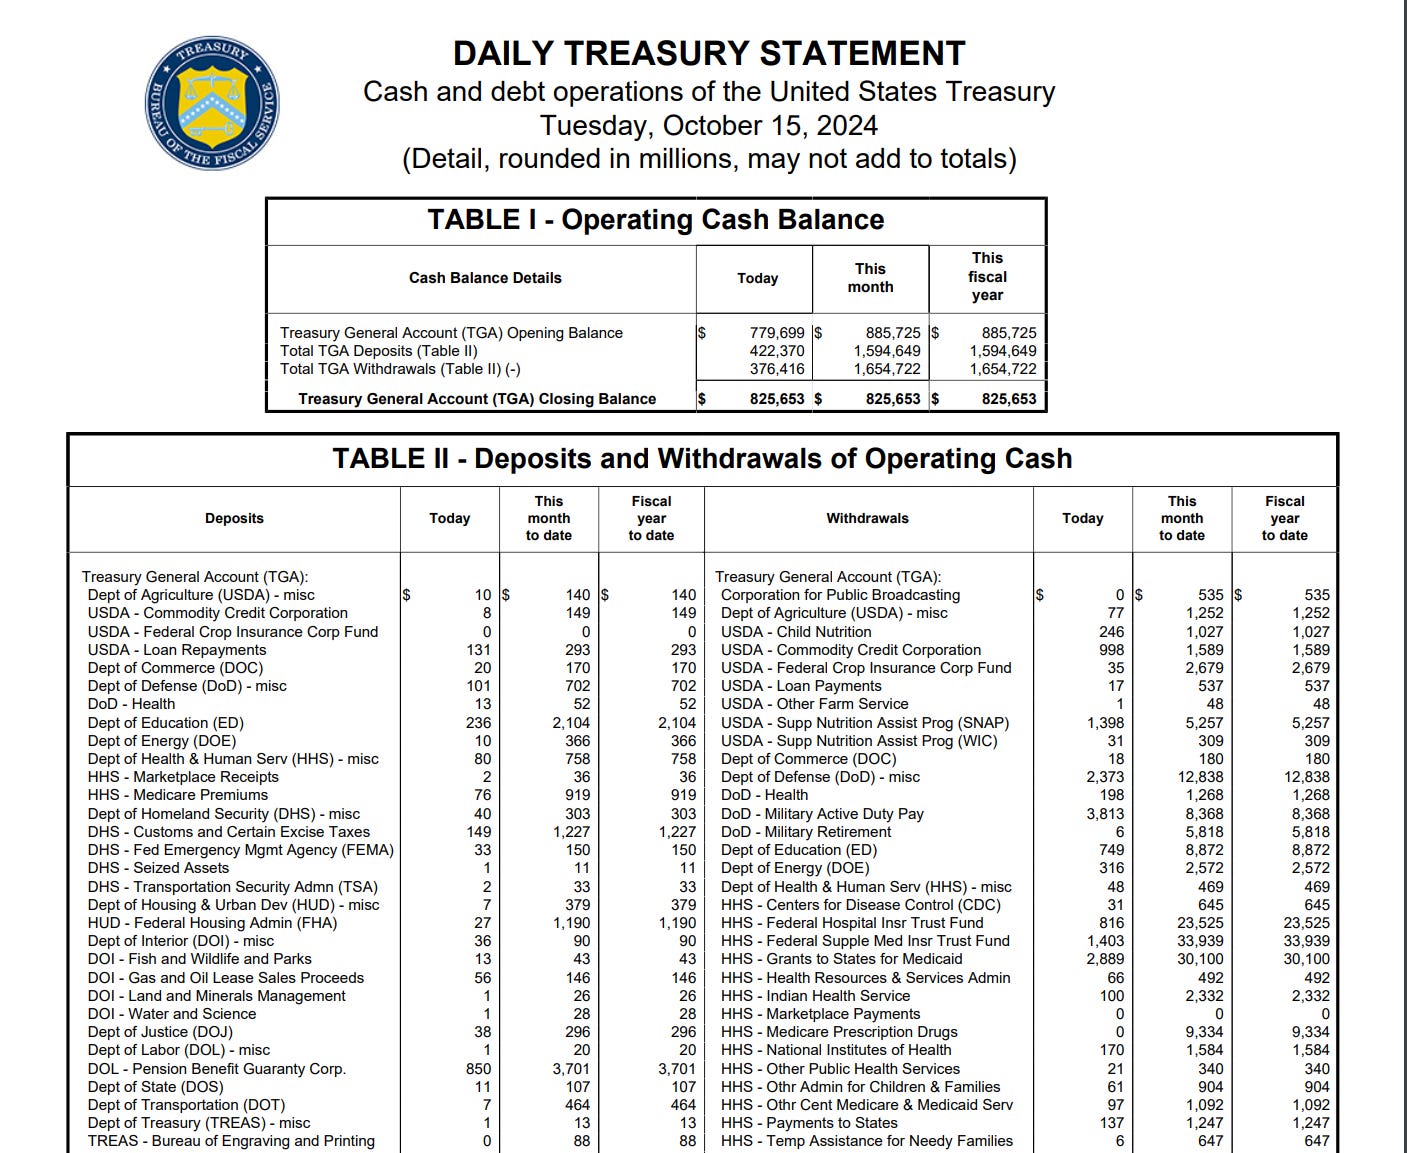
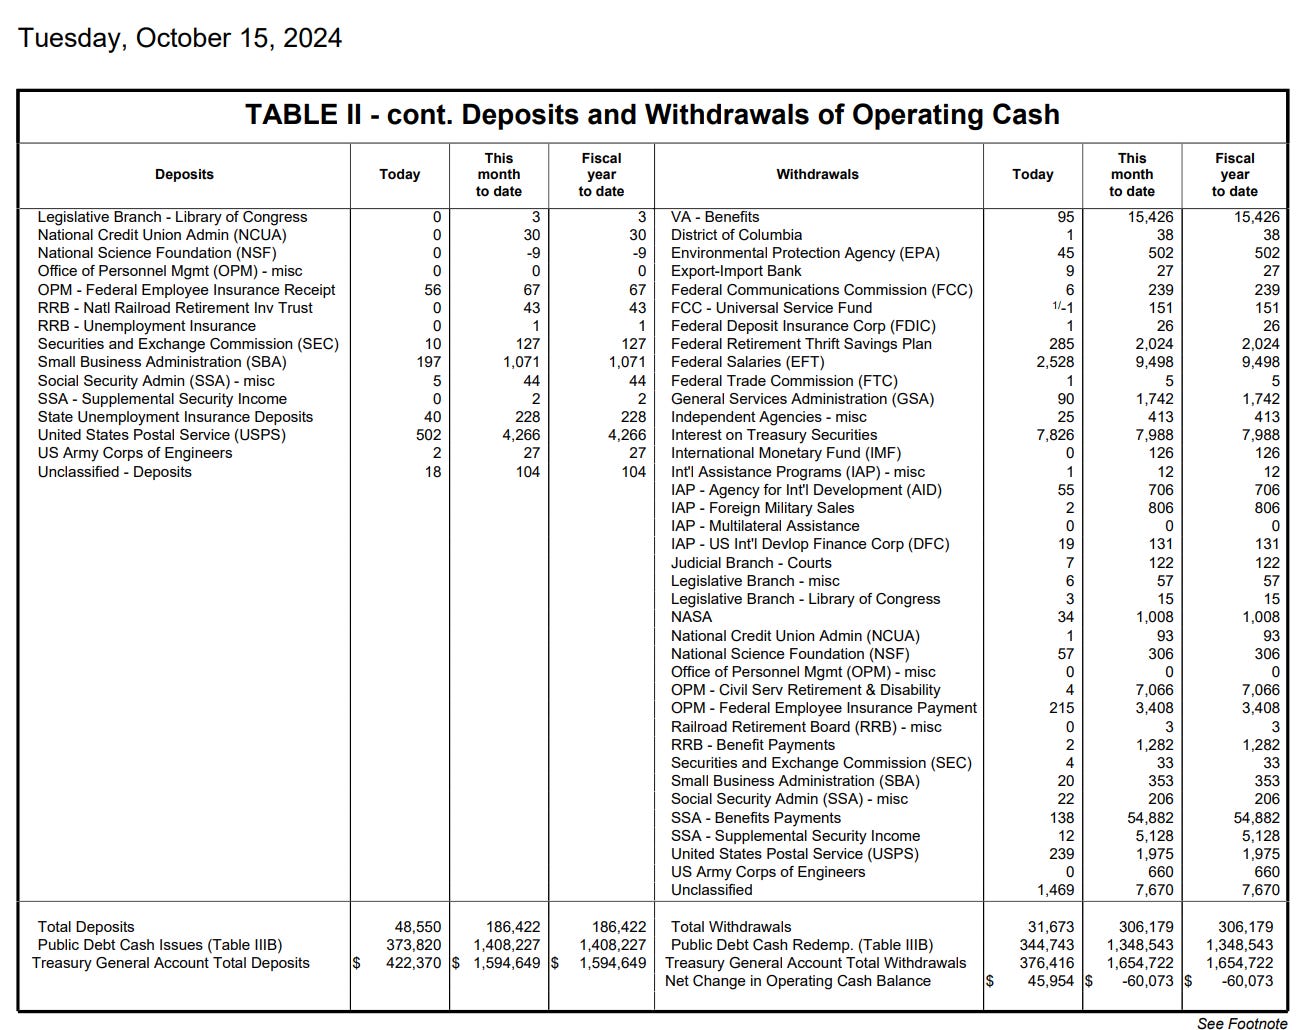
Some days, like Oct 15th, have more deposits than withdrawals. But with the US running 1.5-2b dollar annual deficits most days don’t pushing down on the running balance.
Prudent households aim to keep some minimum level of funds in a household account for a rainy day/emergency. Treasury does too with the TGA, the TGA risk policy level (enough cash to cover one week ahead assuming they must redeem but cant issue new debt)
Over time, deficit spending draws down the TGA, Treasury counteracts this by regularly issuing more new public debt (treasury bills, notes, bonds etc.) then matures (and they have to repay) on a day. This net cash from debt raises the balance of the TGA. When the debt ceiling is not binding. Treasury will issue enough net new debt to keep the TGA at or above the risk policy level. When the ceiling is binding, Treasury will issue as much as they are able under the limit but generally the TGA will draw down until it runs dry, the X-date. Treasury reports the daily issuance/maturity of outstanding debt in Table III A of the Daily Treasury Statement.
From the DTS for Oct 15th 2024
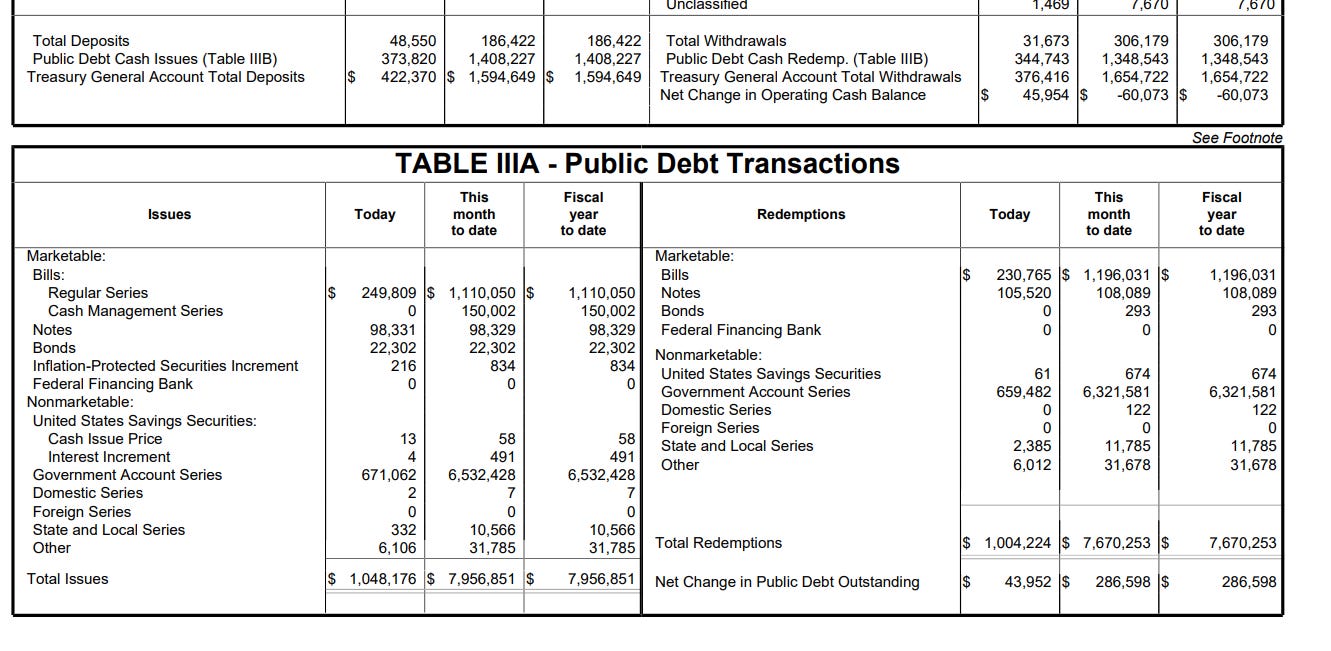
Lets look at the numbers for last Oct 15th in detail so we can understand exactly what the DTS tells us. Oct 15th was specifically chosen because it was both a Tuesday and the 15th of the month. With a few exceptions, Treasury regularly issues debt only on
Tuesdays and Thursday for treasury bills (maturities up to 1 year)
15th and End of Month for coupons (notes and bonds with maturities 2-30 years)
Oct 15th 2024 captures both so it is a nice example.
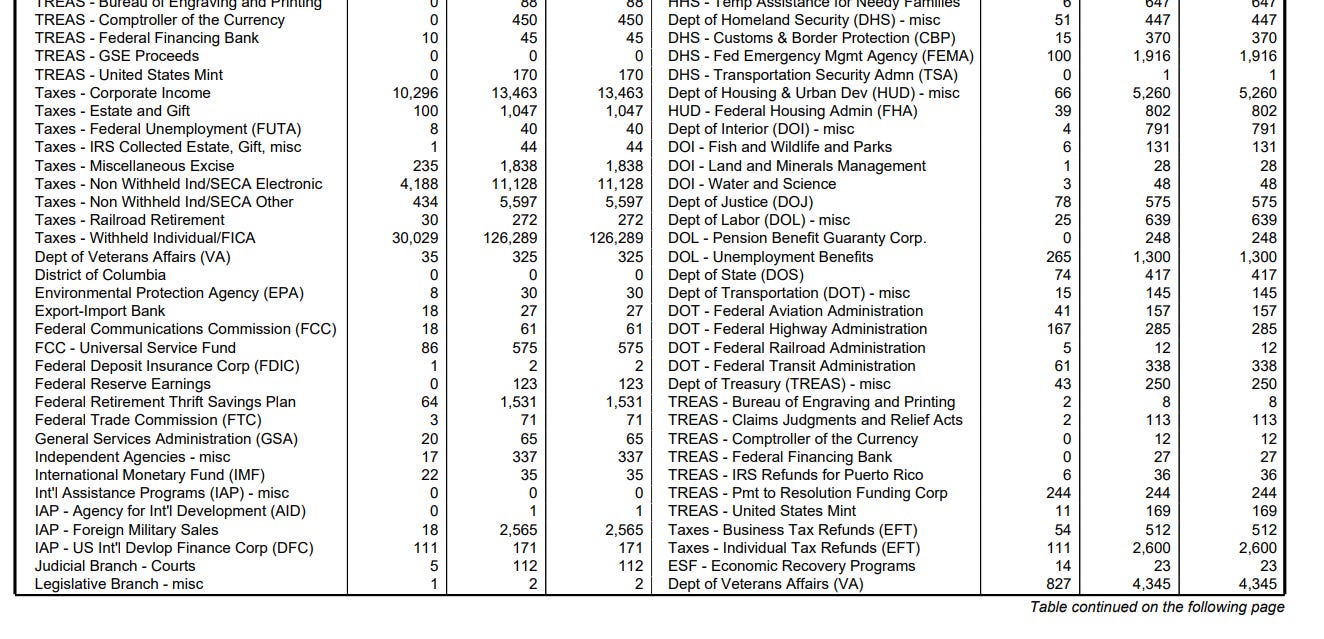
On Oct 15th: 249,809 + 98,331 + 22,302 = 370,442m in new marketable bills, notes and bonds were issued. Note though that it is a little less than the 373,820m in Public Debt Cash Issues deposited in the TGA that day as shown in the bottom of Table II at the top of the image. Those numbers are different because:
Treasury gets cash from more than just marketable debt. (debt that can be resold by its buyer in the secondary markets) They also raise cash from the sale of some, but not all, forms of “nonmarketable” debt.. Specifically they get cash from the sale/cash issue price of US Savings Bonds (check your safety deposit box, you might still have some), Domestic Series bonds, Foreign Series bonds, state and local government series bonds and the catchall Other nonmarketable debt. Notably they do not get cash from the issuance of Govt. Account Series debt though (more on this later) or from the increment added to inflation-protected securities or Savings Bonds. Adding the 13m in savings bonds, 2m in domestic series, 332m in state and local and 6106m in Other nonmarketable debt we get to 370,442 + 13 + 2 + 332 + 6106 = 376,895m in cash received for new debt that day. But that number is now too high vs. the 373,820m in cash that hit the TGA from debt sales that day. Because…
While it is usually close, Treasury does not get cash equivalent to the face value of the debt. Treasury bills always bring in less cash because Treasury specifically sells them at a discount. If they were selling 100b in bills they might only receive 98.5b in cash. When the bills mature, the holders will receive the full 100b face value with the 1.5b difference representing the “interest” payment on the bill. Treasury bonds/notes sometimes bring in less cash than face, but sometimes more. Treasury aims to set a coupon on the note/bond that aligns with receiving cash = face, but only issues coupons in 1/8 (.125) increments so it usually does not precisely line up and when Treasury reopens an issue 1 or two months later they keep the coupon from the original opening which can sometimes mean a price paid for a re-opened Treasury bond as much as 10% more/less than the original opening (October 2023 for example). The discount and premium paid on new issues is reported in the DTS in Table IIIB
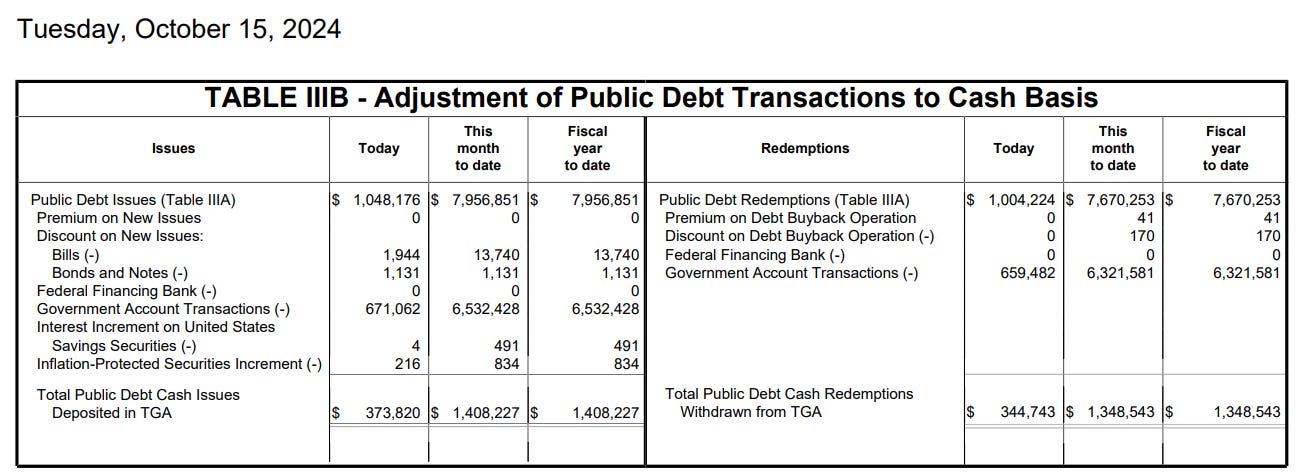
Subtracting the discounts on the bills/notes/bonds issued that day from 376,895m - 1,944 - 1,131 = 373,820, the cash proceeds from the debt issuance that will flow into the TGA balance for the day (offset of course by the withdrawals from the TGA to repay public debt redemptions for the day)
TIPS inflation adjustment and US Savings bonds increments
Most Treasury issued debt pays a fixed value on redemption. 20b in 10 year bonds will repay 20b on the maturity date. It will pay some coupon interest (say 4.5%) semiannually along the way (via the Interest on Treasury Securities withdrawal category in Table II) but the redemption value of the bond at maturity does not change.
Treasury inflation protected securities are an exception to this. These securities have a feature where the principal of the bond will adjust (up or down but never below original face) day to day reflective of inflation. Purchasers get a lower coupon but receive some inflation protection. These adjustments are based on the CPI-U (Urban CPI) 2 month lagged, when it rises over a month, then two months later the increments for TIPS will rise each day and vice versa when it falls for a month. The principal of the debt changes day to day but there is no cash flow associated with that change. At maturity of course cash will flow out of the TGA reflecting the adjusted principal of the TIPS but not until then. A similar dynamic is in play for US Savings bonds increments.
This matters to the debt ceiling though because while there is no cash flow, the principal of the TIPS debt outstanding changes day to day and that debt is subject to the limit. Thus while the total debt is at the limit (like it is now) a 220m rise in the inflation and savings bonds increment for a day must be met by a 220m decline somewhere in the rest of the debt subject to the limit to stay at the current debt limit. Extraordinary measures provide Treasury the day to day flexibility to manage that in an otherwise mostly inflexible Treasury issuance/redemption schedule (Tuesdays and Thursdays, 15th and EOM). More on those measures soon.
Government Account Series Debt
Nonmarketable Government Account Series (“GAS”) Debt (look at Table IIIA again) also does not cash flow into or out of the TGA. But it is debt that counts against the limit so it too matters to the debt ceiling conversation.
What is this debt? It is ~7.6T of debt almost entirely issued from Treasury to government agencies and thus held by the government itself. A sliver of it (300b) is technically beneficially held by the public in a retirement plan option (the G fund) available in the Thrift Savings Plan available to Federal workers but is managed by the Federal Retirement Thrift Investment Board, a Federal agency.
The aggregate 7.6T in debt across the 140ish government accounts holding it fluctuates day to day, each account for its own daily reasons. While cash does not flow between the Federal agencies and the Treasury, new GAS debt that is issued to a fund sometimes correlates to cash that was deposited into the TGA and GAS debt that is redeemed by one of these agencies often correlates to a cash withdrawal from the TGA.
To illustrate, lets use the largest social security trust fund, the Old Age and Survivors Insurance Trust Fund. As of end of day 1/22/2025 it held 2,511,769m in Govt. Account Series debt, roughly 1/3 of the total Govt Account Series debt outstanding.
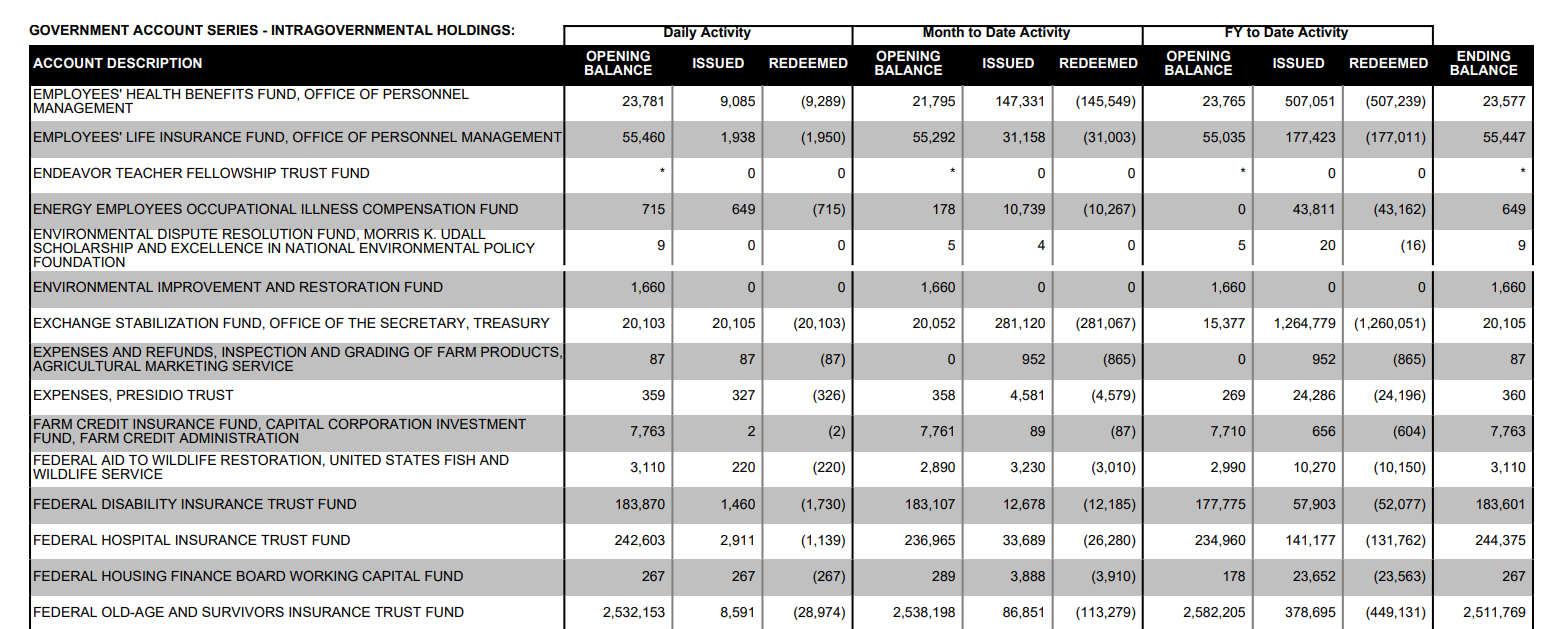
On this day, the size of this trust fund shrank by ~20.4b dollars (28.97b redeemed from it and 8.591b issued into it). Since this debt counts against the limit, if this day had occurred after hitting the debt ceiling, the trust fund would free up 20.4b dollars of borrowing room that all else equal, Treasury could use to issue 20.4b in new treasury bills to raise the cash level of the TGA.
Why did it drop by ~20.4b dollars? Two reasons:
1. 28.974b dollars of debt was redeemed that day to “pay” for the 28.521b in social security benefits paid that Wednesday (bottom of the image)
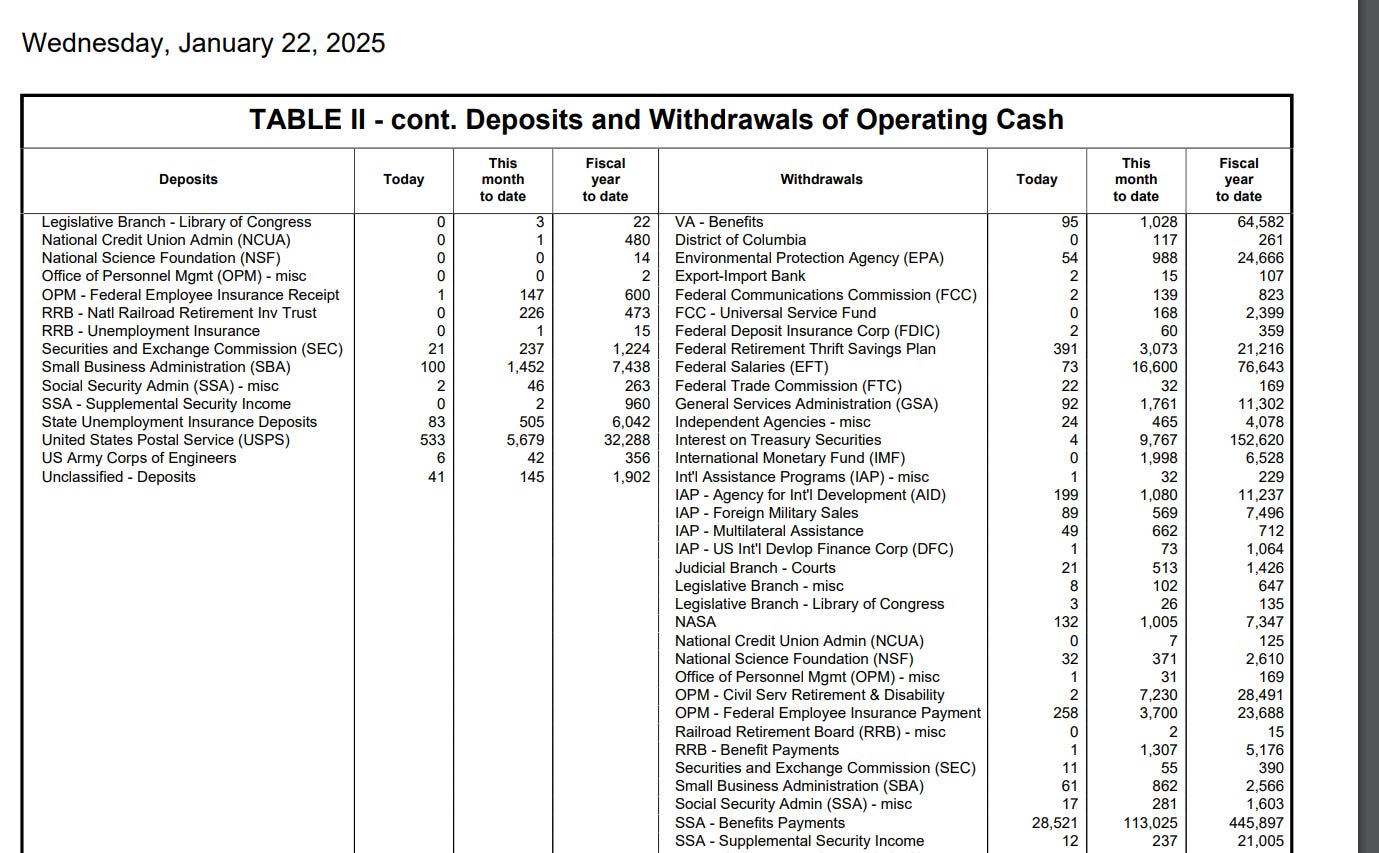
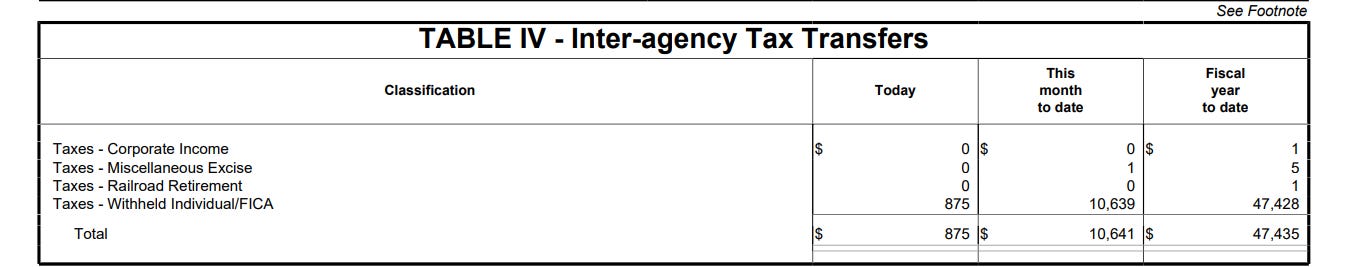
2. 8.591b was issued to the fund reflecting a percentage of the 26.299b FICA withholding plus the (1.586b + 2.724b) SECA non-withheld plus the 875mFICA withholding from Federal Govt workers from the day before.
Again, no cash is exchanged between the TGA and the trust funds, but there is often correlation.
Other fund growth though, may be entirely disconnected from any cash flows into or out of the TGA. For example, the DoD Military Retirement Trust fund grew by a whopping 225b dollars in October 2023 per the Monthly Treasury Statement (Daily level data on these funds only began this past December)
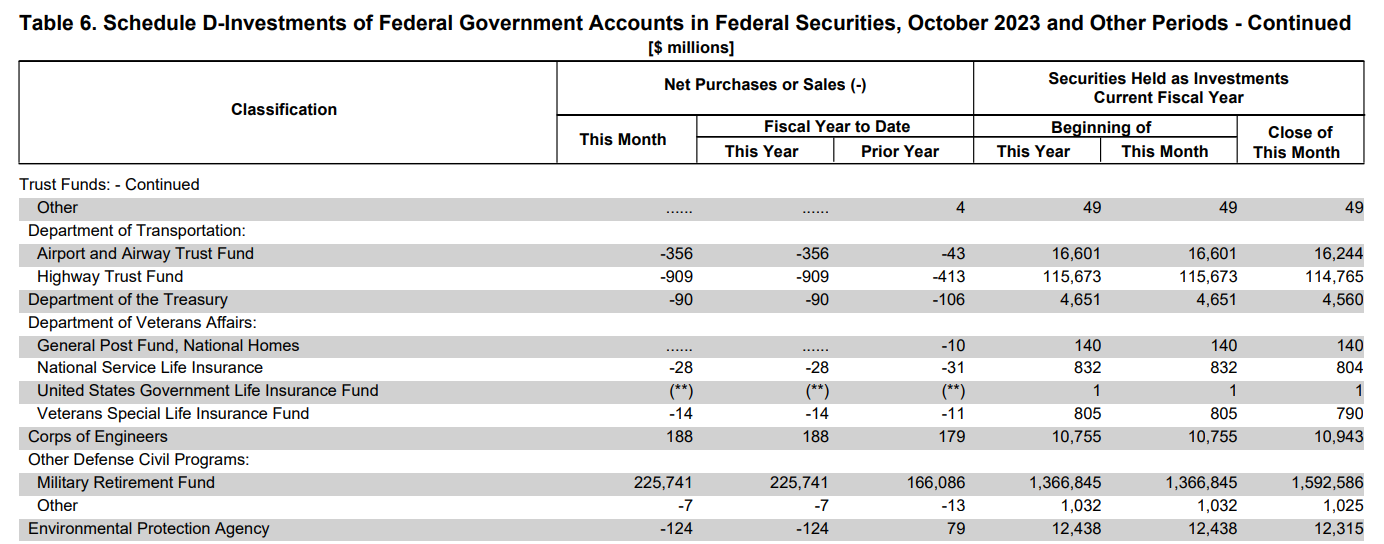
Why? In large part (probably ~160b of it) because the Treasury contributes to the fund to account for unfunded liabilities from military service before the fund was created in 1984 and they make that contribution at the start of the new fiscal year. Treasury “contributes” this appropriated money by simply issuing govt account series treasuries to the fund. No cash involved, but a sudden spike in the debt subject to the limit most certainly is involved. The X-date is prior to Oct. 1st, but if it wasnt, it would have a large impact on it. Note this payment is part of the reason the FY 25 Q1 deficit as reported in the Monthly Treasury Statement (and amplified by Debt Doomers on Fintwit) was so high.
There are other spiky issuances that have nothing to do with TGA cash flows. Notably interest payments to the funds. The Social Security Trust funds receive the vast majority of the interest on their Govt account series treasuries split between the end of June and end of December (30b in each of the two months). This interest is paid by Treasury issuing additional debt to the funds. No cash involved but a spike to the debt under the limit. 6/30 is in the range of this years debt ceiling run but its effects will be blunted by an additional extraordinary measure that also opens up for Treasury on 6/30.
One of these spiky issuances played a pivotal role in the 2023 debt ceiling drama. The income/issuance to the social security trust funds is based on the IRS and Treasury’s estimate of the FICA and SECA taxes that will be received over the month, not the actuals. If more tax is received than was estimated, the trust fund will be underfunded that month and vice versa. Every June the Treasury trues up (vs. actual wage data for prior years) with the funds either issuing debt to the funds to make up for an under-collection over the prior year or redeeming debt if the funds were overpaid. The payments (or collection) hits around June 8th. In 2023, the Treasury general fund had to pay/issue the social security trust funds close to 36b and that forced the X-date to June. Had the payment been close to flat or going the other way (in 2021 the SS trust funds had to refund/redeem ~44b) Treasury likely could have scraped by to mid June and ultimately late July/early August.
Staying at the limit brought to you by Extraordinary Measures
How does Treasury continue to issue debt (marketable and non-marketable) and keep raising cash for a while after the debt ceiling is reached? By using the “extraordinary measures”.
The extraordinary measures are largely comprised of four of those govt funds that hold govt account series treasuries, the G-Fund of the Thrift Savings Plan, Civil Service Retirement and Disability Fund (CSRDF), Postal Service Retiree Health Benefits Fund (PSRHBF) and Exchange Stabilization Fund (ESF). Congress has authorized Treasury to, upon issuance of a Debt Issuance Suspension Period (which Treasury has currently declared through 3/14) ,
Suspend daily reinvestment of the govt account series treasuries in the G-Fund.
There are ~298b GAS treasuries in that fund and they mature/are then normally reinvested every day. Treasury can suspend reinvestment of up to all 298b reducing the debt subject to the limit by 298b which opens up 298b in room under the ceiling to issue marketable debt to generate cash for the TGA to pay for Table II withdrawals. The up to 298b in room also allows treasury to absorb daily fluctuations in aggregate from the other funds holding govt account series treasuries. If in aggregate those other funds have say 15b net positive issuance on a given day, the G-Fund can suspend reinvestment of 15b more than they already have (up to 298b) to keep the debt at/below the limit. When the debt ceiling is eventually lifted or suspended again, the Treasury by law must make the G-fund whole replacing any suspended reinvestments with govt account series treasuries including any interest they would have accrued had the reinvestment of those securities not occurred. Also of note, all benefit payments from the plan will be made regardless.
Suspend new investments into the CSRDF and PSRHBF.
This is the real additional borrowing headroom created by this extraordinary measure. Federal workers are regularly making contributions to the plan and when they do Treasury adds govt accnt series treasuries to the fund increasing the debt subject to the limit. The EM allows them to not do that. The EM also allows the Treasury to accelerate forward redemption of treasuries in the fund equal to the amount of plan payments over the duration of the Debt Issuance Suspension period. This creates additional borrowing headroom at first (about 8.5b in room per month length of the suspension period), but when those payments are eventually made Treasury would under normal circumstances recover the borrowing room as treasuries in an amount equal to the payment were redeemed from the fund, but since they have already been redeemed, they don’t.
At the end of the debt issuance suspension period, Treasury has no extra headroom than it would otherwise have. The accelerated amount could matter some very close to the X-date, particularly if the X-date is much earlier than the end of the declared debt issuance suspension period, but it doesn’t before then other than give Treasury a little more flexibility to temporarily absorb other funds aggregate net positive growth for a given day.
The suspended issuance provide Treasury ~4.5b additional head room a month. It also provides Treasury ~145b additional headroom on the last day of June. Why? That’s when ~130b of maturing bonds held by these funds will mature which Treasury doesn’t have to then reinvest. 15b in interest would also be paid to the funds on this date which Treasury doesn’t have to invest as govt account series treasuries in the funds, proving it another 145b of room to borrow vs. what it would otherwise have.
Exchange Stabilization Fund.
Treasury has ~20b in the fund held in US dollars. The fund invests that balance in daily (like the G-fund) GAS treasuries to earn interest but they are not legally required to do so. Accordingly, Treasury could choose to not reinvest the 20b providing an additional 20b in borrowing headroom. Note though that unlike the G-Fund and CSRDF/PSRHBF, Treasury is not required to restore missing interest due to Treasury choosing not to reinvest in a daily GAS treasuries to free up borrowing room. So expect this EM to be the last to be used.
Note that Treasury can also suspend issuance of state and local govt series non-marketable debt but while it would provide Treasury some additional flexibility to absorb other trust fund fluctuations, it doesn’t increase the overall borrowing room since Treasury receives cash for these treasuries when it issues them and if it suspends issuance it wont get the cash it otherwise would
Also note the Treasury can exchange Treasury Securities for obligations issue by the Federal Financing Bank, but they currently only have about 0.3b of additional headroom from such an exchange, barely worth mentioning.
Ingredients Needed to model out/project the X-date to a specific date
Now that we know about all the types of debt subject to the limit. This is what is needed to project when the TGA will run dry.
Project with reasonable accuracy every TGA table II deposit and withdrawal category amount for every day through the X-date
Project forward issuance and redemption of govt account series debt in government funds. Both regular patterns/amounts of net issuance within a month as well as the timing of any spiky issuances/redemptions from those funds.
Project the increments on inflation-protected securities and US Savings Securities
Project the additional headroom from extraordinary measures both available now and that will become available before the X-date.
Project future bill issuance (including the discount on new issuance to know the cash generated vs. the debt added due to that issuance) that initially keeps the TGA at the risk policy level and when that is no longer possible keeps the TGA as high as reasonably possible without breaching the debt limit until the TGA draws down to zero.
Incorporate all future bill and bond maturities that will occur before the X-date is hit as well as future coupon issuance per QRA guidance.
For any folks new to this substack, I have developed a software model that projects with reasonable accuracy every Table II TGA deposit and withdrawal for every day going out 3-9 months. The model also projects all future daily treasury issuance (including discounts on new issues) and maturities based on debt already issued. As a result the model projects with reasonable accuracy the closing balance of the TGA each day. It also calculates the risk policy minimum level of the TGA, 1 week aheads gross debt redemption and 1 week ahead net non-debt (Table II) withdrawals - deposits, and I use that calculated level along with any guidance in the QRA to project future bill issuance patterns to keep the TGA at that policy level.
I regularly use this model, the Total Treasury Model/TTM, to project upcoming QRAs and regularly provide paid subscribers with those day level TGA projections 3-6 months forward.
Extending the Total Treasury Model with Trust Funds and EMs
To project this X-date cycle I have
Added the tracking and daily projection of the amount of extraordinary measures additional headroom used each day thru the X-date as well as the amount of headroom still remaining for each day
Configured the model to periodically add to and subtract from the remaining headroom as a result of the inflation protected securities and US Savings Bonds interest increments
Configured the model to periodically add to and subtract from the remaining headroom to account for the expected growth or shrinkage of govt funds debt balances over the next 7 months. For now, I model expected fund growth/shrink at a monthly level with any expected spikes (e.g. SS catch-up payment and interest payment) handled at the day level.
Configured the model to add to remaining headroom when new extraordinary measures become available
Configured the model with a projected bill issuance pattern that uses the additional headroom from the EMs to keep TGA at policy level as long as it can and then as high as it reasonably can through the X-date
Increments on inflation-protected securities
Every day, the inflation compensation on Treasury inflation protected securities (TIPS) gets adjusted. For most months it adjusts up each day, but for some months it adjusts down each day. This inflation compensation increases or decreases the face value of the debt and thus increases or decreases the amount of debt subject to the limit.
Specifically this daily adjustment is calculated based off the CPI for Urban customers (CPI-U). The index gets released monthly and TIPS are adjusted using the 2 month lagged values. Thus, for each day in April, the CPI-U value for February - the CPI-U Value for January is evenly divided over each day of April and and an adjustment is added (adjustments on Mondays are 3x the other weekdays to account for Saturday and Sunday) When Feb CPI-U is higher than Jan CPI-U, inflation adjustments will be positive in April and the reverse when Jan CPI-U is higher than Feb CPI-U with the magnitude of the difference impacting the magnitude of the daily changes.
I have no specific skill in projecting the path of the CPI-U but repeating the 2024 path seems reasonable for the purpose of initially projecting the X-date. 2024 saw 2.9% dec over dec growth in the CPI-U. I think it will be a little less than last year but the TIPS base has grown a bit from last year so an easy to implement compromise is to just replicate the monthly drops/rises for February thru August from last year. This approach captures the seasonality in the CPI-U (of which there is a considerable amount) and should be close in magnitude.
I implement this in the model by adding (when inflation increments are negative) and subtracting from the remaining available headroom at the start of the month in an amount = to the monthly expected rise or fall of the combined increments.
Projecting Govt Trust Funds debt growth/shrink
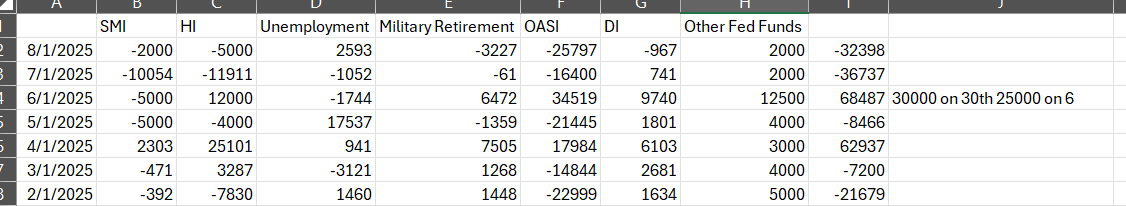
The above table shows my projections for growth/shrinkage in the govt trust funds per month through August.
Supplemental Medical Insurance and Hospital Insurance Funds
These use 2024 numbers (from the Monthly Treasury statements) as a general base but I modify for months where the 1st of the month is over a weekend. Both of these funds see very large redemptions on the 1st of the month (reflected in large Table II payments to medical providers on the 1st of the month). If the 1st of the month is on a weekend though, the fund redemption/TGA withdrawal occurs the business day before leading to some months that have two of these large redemptions in the same month (as reported in the MTS) and some months with none. For such months I re-distribute the redemptions to reflect what the month would look like with 1 large payment.
Unemployment
This also uses 2024 numbers but the monthly “seasonality” matches well with 2023 including the large issuance to the fund in May.
Military Retirement Fund
Again using 2024 as the estimate for 2025, but doing so here because most of the Fund is invested in a govt acnt series version of TIPS and thus the fund will grow/shrink each month in part because of the inflation increment. Since I am using the 2024 path of the CPI-U to project the inflation increment for publicly held TIPS, it makes sense to do the same for this fund.
OASI and DI
Also using 2024 as the base which considering the income into these funds is based on expected FICA and SECA subject tax receipts seems reasonable, some growth in income coupled with some growth in payouts seems reasonable. The big unknown for OASI/DI and Hospital Insurance is what the reconciliation to actuals payment will be in June. For now I am using a 25b payment into the trust funds paid on June 6th since the 8th is a weekend but that is just a guess at this point (erring on the side of being conservative wrt/ the X-date). It shouldnt matter for June anyways and Ill update the model when the SSA indicates what this number will be. Also figuring ~30b in interest payable into the funds on the 30th of June
Other Fed Funds
Combined estimate for all the other funds using a blend of actuals over the past 3 years while excluding extraordinary payments/redemptions (like happened with the deposit insurance fund in the wake of the 2023 bank failures). Note that June sees a noticeably higher expected inflow into these funds. This is due to an expected transfer of ~8b into the Federal Housing Administration Fund. I believe this reflects payments on upfront and annual mortgage insurance paid to the FHA but only result in issuance to the FHA Fund periodically. Last year this issuance was 19b (also made in May) but the budget for HUD indicates this payment should only be about 8b this year.
CSRDF
You might note that I have not included the CSRDF in the above table. I have deliberately excluded it because I have chosen to model the debt headroom at a straight 8.5b a month (unlocked each time I project Treasury to extend the debt issuance suspension period) which reflects the headroom that would be generated when the 8.5b in payments/redemptions from the fund go out each month and not then offset by new issuance into the fund which is suspended because it is an EM. It also removes the interest payment to this fund in June from being rolled up into the general modeling of the govt fund activity.
Resulting Monthly Configuration for EM Headroom
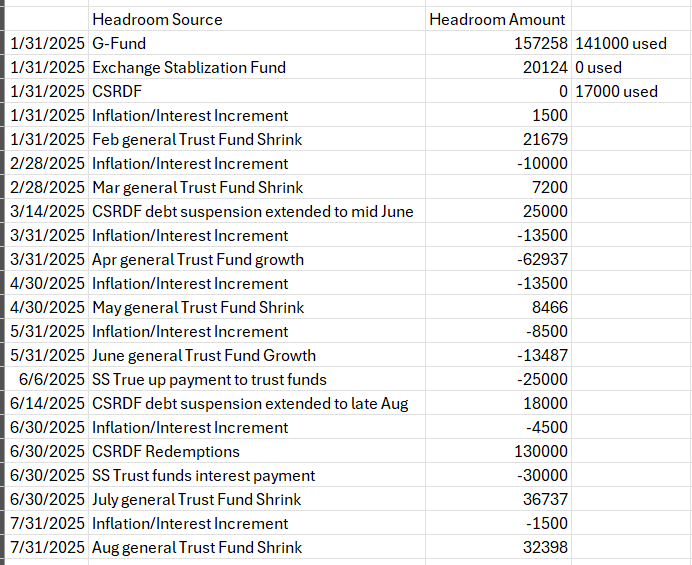
This table shows how the TTM is configured both initially with EM headroom, about 130b being used and 205b available going into 1/30, and then how it is modified to add/subtract from available headroom to account for inflation increments, monthly growth or shrink of the trust funds, additional EMs opening up and notable payments to the trust funds.
Month Granularity for headroom additions is too coarse, next up for the TTM
Applying the headroom changes due to inflation increments and the govt fund growth at a monthly level is coarse and it fails to capture significant intramonth headroom changes that happen day to day and should be predictable. For example. The govt funds fall by 40-50b on the first day of the month due to payouts from the medical trust funds. Social Security (OASI and DI) fall big on the 3rd and then the 2nd, 3rd and 4th Wednesdays of the month. The income to the the Social Security and Medicare trust funds ties to the amount of FICA and SECA taxes collected the previous day. These intramonth patterns are predictable though. It doesnt matter to predicting the X-date until we get into August , month level granularity is good enough. It does matter though for projecting each days TGA level because it allows me to better predict what the bill issuance ramp down looks like. For both reasons I will further enhance the TTM to project daily growth and shrink of all the funds that are big enough to care about . A month of two more of the daily data on these funds should yield any patterns I dont already have. Ill do an update post once I have that worked into the model.
For free subscribers, thank you tremendously for the time it took to read this. Upgrading will provide you access to full model output and the daily path of the TGA from now until the X-date.