QRA borrowing estimates retrospective
What went wrong with the 1.2T Q3 projections

Greetings,
I have to admit, of the various things I had on my bingo card going into this month, being called out by zerohedge for being hyperbolic was certainly not one of them. (https://www.zerohedge.com/markets/treasury-publishes-borrowing-estimates-q3-which-sneak-below-median-estimate) I love me some irony; and that is about as rich as it comes. But to be fair to them, the 1.2T Q3 borrowing estimate call I made in my piece from Sunday was outlier and very incorrectly high, but that wasn’t due to hyperbole but rather to a bug in the model and a flaw in how I calculated the borrowing estimate that only mattered itself because of, ironically, calendar effects. The Q3 gaffe aside, the projection of an upward revised Q2 proved out, the TGA assumed level for 9/30 was in fact increased (albeit only to 850 instead of 900b), and the general approach of using my detailed daily TGA projection model to project the borrowing estimate worked out super well or would have minus the bug/flaw. Things that are easily fixed.
This post will give a full accounting of what went wrong with the Q3 projection, discuss how the borrowing estimate should have been calculated (and how it will be calculated for future QRAs) and conclude with the models latest TGA daily projections, which have been updated using information from the borrowing estimates yesterday. I am including that ouput as a spreadsheet for easier reference.
The Q3 Gaffe
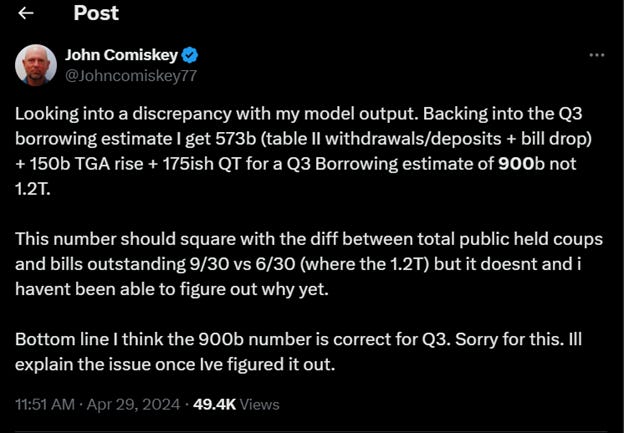
I was uneasy about the 1.2T call since publishing the piece. I don’t mind being an outlier outside of consensus, I go where the data leads me, but it felt uneasy. That it was 200b more than last years Q3 borrowing estimate while raising the TGA end of quarter level by less gave me pause while I was putting the piece together. I convinced myself that discrepancy was covered by “calendar effects” of when the September coupons settled last year vs. this. The analysis I used to convince myself (and wrote about) was bullocks. The reality is there is an underlying truism that on the date net debt settles it will both add to the TGA and be reflected in the borrowing estimate for the qtr. It cant just be reflected in the borrowing estimate. That truism nagged at me yesterday morning eventually leading me to double check the borrowing estimate by calculating it via the approach I used last fall, before the model was fully developed. Specifically, 1. calculate the “fiscal” deficit, Govt outlays less receipts and also less bill drop over the quarter 2. Add in any expected rise to the TGA end of quarter level and 3. Add in QT over the quarter. Doing this yielded values of 1. 573b 2. 150b and 3. ~175b which summed together = ~900b, not 1.2T. So I frantically pored over my code trying to figure out the discrepancy between the 2 figures before the 3:00 deadline. Running out of time and pretty certain that the 900b figure was actually correct. I posted the following to X with 9 min to go (computer is on PST)
Better late than never I suppose, but hardly an absolution.
Of course, the 900b number proved correct (almost exactly so with the actual 847b from the QRA when you account for the 50b less rise in the TGA (to 850 instead of 900b) than I was predicting. But why were my publicly held coupons and bills numbers 9/30 vs. 6/30 so wrong?
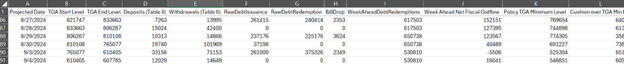
<quick aside. I have included the model output as it was at the time I published my piece Sunday night, except in spreadsheet form here instead of the pictures in the piece. You can see the fiscal deficit of 573b by summing the Table II withdrawals less the Table II deposits over Q3 and adding the sum of the bill drops over the qtr.>
First there was a bug in the model configuration that accounted for ~200b of the difference. Labor day got me. Since August 31st is on Saturday this year, the end of August coupons would normally settle on the next Monday (September 2nd). But that’s labor day and thus the settlement date is pushed to September 3rd. Unfortunately, I configured them to settle the 2nd. The result was that the ~200b in proceeds from the coupons got lost to the daily TGA projection model (and critically the redemption amounts for the maturing coupons were not lost). You can see this in the debt issuance figures for that day
The 261b issuance represents only the bills, excluding the 200b in coupons that will settle that day.
Oblivious to this omission, I cranked up other bill issuance in the qtr to make up for the missing 200b and get the TGA actuals above the minimum level proscribed by policy on Sept 26th. Ending up with 200b more bills than needed.
The missing 200b in coupons was not missing in my end of september outstanding debt numbers. So with the additional 200b in outstanding bills at the end of September, voila 200b more borrowing estimate than there should be. What about the other 100b?
Well “calendar effects” got me. Ironic huh, since I used a phantom “calendar effect” to justify to myself why the Q3 borrowing estimate was more than last year. The issue is, I modeled my month end outstanding debt (coupons and bills) tables off the Treasury’s monthly statement of the public debt. Notably, those reports exclude end of month coupons that have yet to settle because the end of month falls on a weekend. These reports also exclude the coupons that matured that weekend but that haven’t been paid out yet (since it’s a weekend). Ive never understood excluding both, but I coded the original debt projection model to emulate it. Accordingly, my June end of month coupons reflected about 100b of publicly held coupons less than there actually still were (since the TGA effect of these bills hit 7/1). That omission makes the 9/30 vs 6/30 publicly held coupon number look 100b bigger than it actually is. 200b + 100b yield the 300b error. The lesson for the future, is to only use the fiscal deficit + TGA change + QT approach going forward and only use the month end totals (accounting for the quirky months that end of weekends) for bills and coupons when the specific change in bills vs. coupons is needed for some reason over the qtr (like for RRP projections). Had I just done this Sunday I would have crushed the Q3 call instead of explaining a gaffe.
The Silver Lining
The 900b number predicted ground up from the sum of the daily fiscal deficits over the qtr etc. hit almost “on the screws” when you adjust for the 50b less TGA end of quarter level rise. This means the models projected daily fiscal flows (at least in the aggregate over the qtr) are very closely aligned with Treasury’s internal modeling. Its validation of my approach, if I can just get out of its way. So I suppose zerohedge’s dunking on me was justified based on how outlier my mistake based Q3 call was prior to my last minute update, but the reality is the tax/spend daily projections of the model worked out like a champ and portends good things for projecting the summer QRA.
Q2
What was a bit disingenuous in the zerohedge piece yesterday though was their victory lap on Q2, particularly as pertained to my own. Zerohedge projected a “would not be surprised” range of 120-240 for the Q2 borrowing estimate. I set a range of 275b to 300b. The actual was 243b. The most fair way to evaluate projections when given as a range is to compare the midpoint of the range vs. the actual, otherwise if you make your range large enough you will always be correct! By this measure, I was +44.5b and zero hedge was -63b. I was both more accurate and directionally correct. I am a little surprised that my own modeling and Treasury’s are off by 44.5b between now and June 30th, but it is what it is. Either way Ill take the more right than wrong victory on Q2.
TGA Level End of Quarter rise
The correct call on the 100b rise in TGA end of qtr level was also a win. The miss on that call last fall didn’t bother me too much, I had a slight but material misunderstanding of the rule. The miss on that call in the winter was more annoying because I sloppily couldn’t see the issuance pattern that would have stopped me from making that call until after the borrowing estimates came out. As I explained in my piece on Sunday though, There really was no way for Treasury to avoid raising the assumed end of qtr level given the minimum policy level on 9/26 and coupon issuance the next two business days. Had I been wrong it would have meant that I actually didn’t understand how it worked. Fortunately that went right.
Updated TGA projection model
I have subsequently corrected the Total Treasury Model to address the missing 200b in 9/3 coupons, and correlated 200b too much bill issuance in Q3 to compensate. Its impossible to precisely predict the tenors and changes but the general trend for Q3 should be increases the first couple weeks of July (and maybe one in early August) and decreases first couple weeks of September thru the end of the qtr.
As a mea culpa for the way too late corrected Q3 miss I have included a spreadsheet with the daily output of the TGA projection model through the end of September. Im sure it wont perfectly verify, but given how aligned mine and Treasurys qtr numbers are it shouldn’t be too too far off. One big caveat about it though. I adjusted for the 45b Q1 fiscal deficit discrepancy between my model and Treasury by adding 45b to the start value of the TGA at the beginning of the run. Obviously that will make the TGA level too high vs. reality for the next couple weeks becoming less pronounced as it unifies at the end of June. With only a day, it was simply the most expedient way to adjust the model to Treasury’s projections (which I fully assume and hope are a little better than my own). Ill overhaul the 100s of spending and receipt categories over the summer to tighten them up in advance of the next QRA so I can confidently project through the end of the year.
So again, my apologies for the mistake and the resulting way to high Q3 call and as always, Thanks for reading!
John
PS – Appreciation shout out to Charles McElligott for his kind words and mention in his piece on Monday (https://www.zerohedge.com/markets/heres-what-treasury-will-announce-its-borrowing-estimate-3pm-today) Wish it had come under somewhat different circumstances but that is what that is. Always next time.
One spreadsheet with two tabs is attached:
OriginalModelExcel tab (model output used for the Sunday piece including the missing 200b coupons offset by the compensating 200b bills
UpdatedModelExcel tab (model output as referenced above)
thank you!
Impressive work John! TKS for sharing this! Regards (from Portugal)