Projecting the Quarterly Refunding Announcement
The Coupons are Coming!, The Coupons are Coming!

TLDR
· Coupon (excluding TIPS and FRNs) issuance will rise from 714/qtr in Q3 2023 to 1044/qtr by Q3 2024 following a blend of the issuance scenarios in the TBAC Charge released with the August QRA
· TGA steady state level likely to rise to 850b at end of year and stay there in 2024
· A bit over 500b more net new bills to come in Q1 before paring back a bit in Q2
Full QRA recommended financing projections for the next fiscal year herein
Greetings,
I love debugging software. It is by far my favorite part of the software development lifecycle. When my primary job function was coding itself, I would rush through first cut code just so I could start debugging it to get it to work. Whenever I would finish a task early, I would often just start attacking the backlog of defects. As I evolved into management roles, I did even more debugging. I used it as a tool to really understand the skills and workmanship of the teams I oversaw. There is no better way I know of to evaluate a developers performance than to fix defects they created. Uhh John?….. the article title led us to believe that you would be issuing a Quarterly Refunding Announcement (QRA) projection, because you know… the title of the article is Projecting the Quarterly Refunding Announcement, so all due respect, why the hell are you talking about debugging software. Because I have spent thousands (possibly 10s of thousands) of hours of my life doing it and one of hard rules I developed was to always read the error message, twice to make sure I wasn’t glossing over it. You would be amazed how many development hours are wasted by developers chasing their intuition or pet theories on whats causing a bug when the error message was telling them exactly what was wrong and usually also exactly where to go to fix it all along. So how does this relate to the upcoming QRA? Because I think the TBAC charge that was included in the August QRA, specifically the future issuance scenarios, is analogous to one of those bug error messages. I think its basically Treasury telling us what the future coupon issuance is going to be through next summer. Not precisely, but close enough to get a very good idea of the coupon supply coming in Q1, Q2, and Q3 of next year (and of course the remainder of Q4 this year).
Wait though, didn’t you just write an article in late August that used the TBAC Charge to project Treasury Issuance? Like this one https://johncomiskey.substack.com/p/treasury-issuance-is-what-really ? Yeah I did, but you had to dig into the attached spreadsheets to really see it and I didn’t really hammer home the point in the post itself on what the future coupon issuance would likely be. In addition, we have additional actual issuance since I wrote that article which provides more hints on what the precise issuance increases will be. And at the end of the day, I like to project things and the upcoming QRA is a pretty anticipated so I figured I would throw my projection hat into the ring.
Reviewing the TBAC Charge Issuance Scenarios
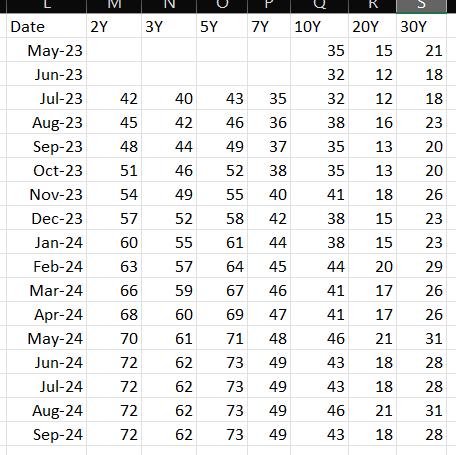
To start, lets review the TBAC Charge 3 future issuance scenarios included in the August QRA.


Look closely at the final projected issuance numbers for each of the scenarios (June 2024). All of them reflect a substantial increase in the monthly amount of coupons being offered. Specifically:
· 2-Year goes from 42 (Jul 23) to 51 (actual Oct 23) to 64-79 a month by June 24
· 3-Year goes from 40 (Jul 23) to 46 (actual Oct 23) to 62-67 a month by June 24
· 5-Year goes from 43 (Jul 23) to 52 (actual Oct 23) to 65-81 a month by June 24
· 7-Year goes from 35 (Jul 23) to 38 (actual Oct 23) to 47-51 a month by June 24
· 10-Year goes from 35/32 (Jul 23) to 38/35 (actual Oct 23) to 45/42 – 49/46 a month by June 24
· 20-Year goes from 15/12 (Jul 23) to 16/13 (actual Oct 23) to 17/14 –23/20 a month by June 24
· 30-Year goes from 21/18 (Jul 23) to 23/20 (actual Oct 23) to 29/24 –35/32 a month by June 24
Additionally note that while the scenarios vary somewhat with more or less shorter/longer tenors, they all end up in a similar enough place with the amount of quarterly coupons being issued 1017-1085 (excluding the TIPS and FRNS) with the 1017 heavier with longer tenors and the opposite for the 1085. This is versus a quarterly issue rate of 774 currently. So if you believe the parameters Treasury put around the TBAC Charge exercise back in July indicates where Treasury thinks the coupons need to go, then we have quite a bit more coupons to come. I believe the upcoming QRA will reflect as such. What will the precise issuance look like?
Projecting the Issuance
To project the specific issuance that’s coming I blend the actual issuance/increases through October with what the August QRA said about increases to come in the 4th qtr, to project something plausible to reach the target range of the 3 Charge scenarios. Doing so I come up with the following increases (note they are actual above the black line separating October and November)

Which results in the following offering amounts
So the issuance projections I am using ultimately result in Q4 FY2024 rates of
· 2Y – 72 a month (64-79 was the TBAC Charge scenarios range)
· 3Y – 62 a month (62-67 was the TBAC Charge scenarios range)
· 5Y – 73 a month (65-81 was the TBAC Charge scenarios range)
· 7Y – 49 a month (47-51 was the TBAC Charge scenarios range)
· 10Y – 46/43 a month (45/42 – 49/46 was the TBAC Charge scenarios range)
· 20Y – 21/18 a month (17/14 –23/20 was the TBAC Charge scenarios range)
· 30Y – 31/28 a month (29/24 –35/32 was the TBAC Charge scenarios range)
Pretty close to down the middle of the 3 TBAC Charge scenarios, closest to the Neutral Issuance scenario. Will it play out exactly as I have projected? Probably not exactly, but I do believe it will stay within the range of the TBAC Charge scenarios. Why? Two reasons. 1. I don’t think TBAC would have gone through the Charge effort and then published the results in the August QRA documentation without a strong level of intent (At least at that time) of carrying it out (like error messages in code, sometimes you just gotta read the lines themselves, not between them). 2. Unless QT ends or Congress finds deficit reduction Jesus, increasing coupons to this extent is necessary to keep the bills from blowing further past the 15-20% of outstanding issuance range than it already is. But John, isn’t the landscape different now vs the summer with the 10yr closer to 5% than 4%. Yeah, it is somewhat but the term premia is still fairly cheap relative to longer term history so I don’t think it changes the calculus but perhaps it does, in which case my projections will be wrong, as always make up your own mind.
Putting it in the lovely QRA format (sarcasm here, cmon Treasury you really can do better) for Q423 / Q1FY24 we get

The coupons, of course, reflect my issuance projections. The net bills projection for the quarter is interesting. Assuming my coupon projections are correct (and even if they aren’t the following analysis will still mostly hold true), one of two things will have to happen 1. Bill issuance will have to slow down between now and the end of the year or 2. The target end of year TGA level will need to rise significantly above the 750b EOY level predicted by the August QRA. Why must one of those two things happen? Well the math demands it.
First lets define our starting point. At the end of September the treasury had ~657b sitting in the TGA (very close to the projected 650b level from the August QRA).
Next lets define all the things Treasury will need to “pay” for in Q4.
1. ~171b for QT (22.5b of September’s roll off which occurred on 10/2, 60b for both October and November, and 28.5b of Decembers roll off (the remainder rolls off on 1/2 )
2. ~400b for Non-Debt related deficit spending. The difference between all the non-debt TGA withdrawals and non-debt TGA deposits in the quarter. How do I get to that number? Well to start I take the actual deficit through last Friday which isn’t a deficit at all but rather about a 7b surplus. Remember those California tax receipts that failed to materialize in April and brought the x-date forward from end of summer to early summer? Well they hit this month. Last year, it was a 44b deficit, a 50b swing. So starting at a deficit of -7b from 10/20, I look to last years realized deficit over the same time period (10/21/22 to 12/30/22) of 323b and up it by about 25%. I base that mostly on my TGA projection script though I do have some uncertainty there, not least of which is that the budget for FY 2024 is still notional until Congress solidifies it. I think if anything it will realize a little lower than 400b but it’s a good enough estimate for this analysis I think
3. ~108b for “bill drop” and associated DTS Table III B spending. As I was painfully reminded of last May whilst predicting the X-date, bills are paid for at a discount to par while redeeming at par (notes and bonds sometimes issue at a discount to par as well when prevailing rates are higher than the stated coupon….looking at you October 10-year reissue). Anyways 100b of bill issuance brings in less than that. That delta through the end of the year is captured in my 108b amount
Add them up and we are ~678b in stuff Treasury needs to pay for. If we assume 535.24 in net new bill issuance through the end of the year and add that to 346.56b in net new coupons we get a cash raise of 881.8b. Ok hold on a second John, why assume 535.24 in net new publicly held bills through EOY? Because that’s what it will be assuming the Treasury does not alter the current rate of issuance across each of the bill tenors before the end of the year. The issuance rates have held steady the past couple weeks so it seems a sane place to start.
EOY TGA Level likely to Grow
Assuming that cash raise of 881.8b and treasury needs of 678b we have ~200b additional dollars. It has to go somewhere (or we have to raise less). In the August QRA Treasury indicated the EOY TGA level would be 750b, so 100b is spoken for. I believe the remaining 100b will go to an November QRA update to the end of year TGA level to be 850b, with a chance if the deficit is notably smaller than that 400b to finish somewhere between 850 and 900b regardless of what the QRA states.
Ok, but are you just making shit up now John to make the numbers work out, conveniently increasing the EOY TGA level to what it needs to be so you don’t have to project decreased bill issuance? Actually no, there is solid reasoning behind this. Thanks to the outstanding sleuthing of @hegedusAero who pointed out the Treasury policy goal of maintaining a cash balance sufficient to meet a week ahead cash need including “both net fiscal outflows and the gross volume of maturing marketable debt.” (see here https://home.treasury.gov/news/press-releases/jy0581) Using my TGA projection scripts (updated version of the ones I used to estimate the debt ceiling) There are a number of weeks over the next year (e.g. next week, and notably the TGA level is ~820b as of Friday) where that week ahead cash need will likely be well north of 750b and until the increased coupon issuance allows the bill issuance to actually net reduce, it will keep it that way so a move to 850b seems needed to stay within that policy goal.
On to next year
So what about Q1? And for that matter how about Q2 and Q3? Well, for the coupons I just stick to the issuance increases I detailed above using a blend of the TBAC charge issuance scenarios. For the net bills we need to repeat the exercise we did above to back into the net bills by taking what Treasury has to pay for in a quarter (QT, bill drop, and non-debt deposits/withdrawals deficit : I assume the TGA level will stay constant at 850b) and subtract the net coupons from it.
Unfortunately the deposit side of my TGA projection script needs additional overhaul before I really trust its output into 2024, so instead I just use a blend of the last two years monthly deficits to get a plausible enough breakdown of the quarterly deficits to hit a full year 1550 deficit (note 50 less than the common 1600b due to the 50b in bonus tax from California this month). So with that my Q1-Q3 spend is
Q1: Deficit – 670b, bill drop - 120b, QT – 173b
Q2: Deficit – Flat, bill drop – 115b, QT – 185b
Q3 Deficit – 480b, bill drop – 115b, QT 171b
The projected deficit and bill drops likely wont be perfect but they should be close enough to get a good idea of what will happen, with the impact of deltas between it and what realizes seen in increased or decreased net bill issuance. Accordingly, Q1 – Q3 are.
Q1

Q2

Q3

Finally, I mentioned earlier as one of my justifications for why I think the coupon issuance will stay within the range of what the TBAC Charge scenarios that increasing the coupons will help Treasury get back to a having Bills as a Percentage of Treasury Debt outstanding back to within the historically desired 15-20% range. Even with the increased coupons it won’t happen by September 2024, but it will be at least moving in the right direction
· 9/23 - .2054
· 12/23 - .219
· 3/24 - .232
· 6/24 - .220
· 9/24 - .217
It will likely take the end of QT to really get it back in the 15-20 range which is probably a year out from 9/24. I mean Congress could also tax more or spend less to reduce the borrowing needs also to help get it down (without even further coupon issuance), pause for laughter, but Im not holding my breath on that one.
Hopefully these projections and the rationale behind them are useful. If they are, please consider restacking, reposting, retweeting the article or tweets about it. I am deeply grateful for any amplification. Also, while I try to be meticulous about showing my work, explaining my assumptions and the rationale behind them and I am in general very happy with my track record, Its entirely possible Ive missed something material (like I did with bill drops in my initial X-date projection) so never substitute my conclusions for your own. Use my conclusions to bolster trust in your own conclusions where we agree and to challenge your prior conclusions when we don’t. Also as always, if you draw any different conclusions, I would love to hear about them in the comments. With that Ill sign off.
Thanks for Reading!
John
Great article. Tremendous detailed knowledge, much better than bank sell side
Love the analysis. My one comment would be that Yellen did mention recently that she’s comfortable running above their historical 15-20% range for bills. MMF are eating that issuance up because it’s the sweet spot for them to move out of RRP to consume US debt.