January FHA Delinquency Report
How high will the high watermark be?

The last two months have shown massive increases in the serious delinquency rates for FHA loans in GNMA mortgage backed securities (~7 out of the 8 million outstanding FHAs, and much better performing than the 1 million that are not). This was completely expected as a mechanical effect of the tightening of the loss mitigation procedures and the end to endless partial claims and loan modifications.
January represents one last month of this mechanical effect. Loss mitigation workouts like partial claims and loan modifications entered into since the new rules took effect on Oct. 1 literally cannot have completed their trial payment plans and thus reflected in the data as current and lower the numerator in the delinquency rate calculations. So January will likely be the high water mark as some of these plans start to complete next month.
Just how high will the delinquency water reach?
*** No paywall this month but please consider becoming a paid subscriber to support my work ***
Summary….
DLQ is up 22bps in January, which is actually pretty big considering it dropped 65bps last January and 15bps the January before.
SDLQ is up huge in again in January, nearly another 50bps
Detected partial claims are slightly down but mostly the same as the last two months suggesting the level of natural cures is ~8500/month
January Partial Claims
My algorithm detected 8401 standalone partial claims were completed in January covering ~43,200 missed payments on those 8401 loans. Down but only slightly from Decembers 8837.
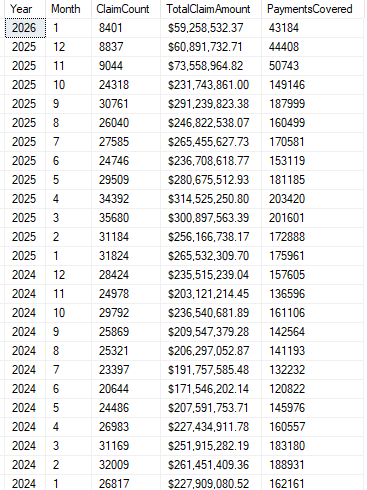
Since partial claims could not have actually been completed in January due to the requirement of 3 successful trial payments. The data suggests that the current level of natural loan cures in a month (where the borrower scrapes together the funds to pay off the arrears and bring the loan current) is actually in the vicinity of 8,500 a month for the FHA loans in MBS.
Headline DLQ significantly Higher in December. SDLQ goes boom again
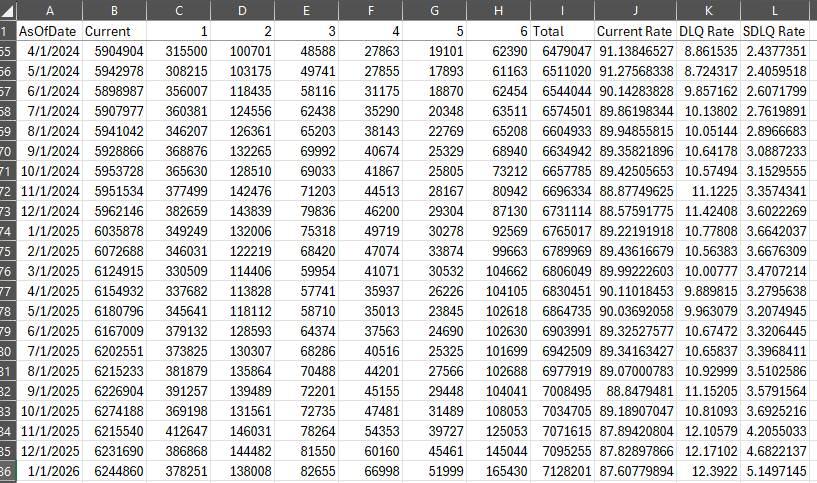
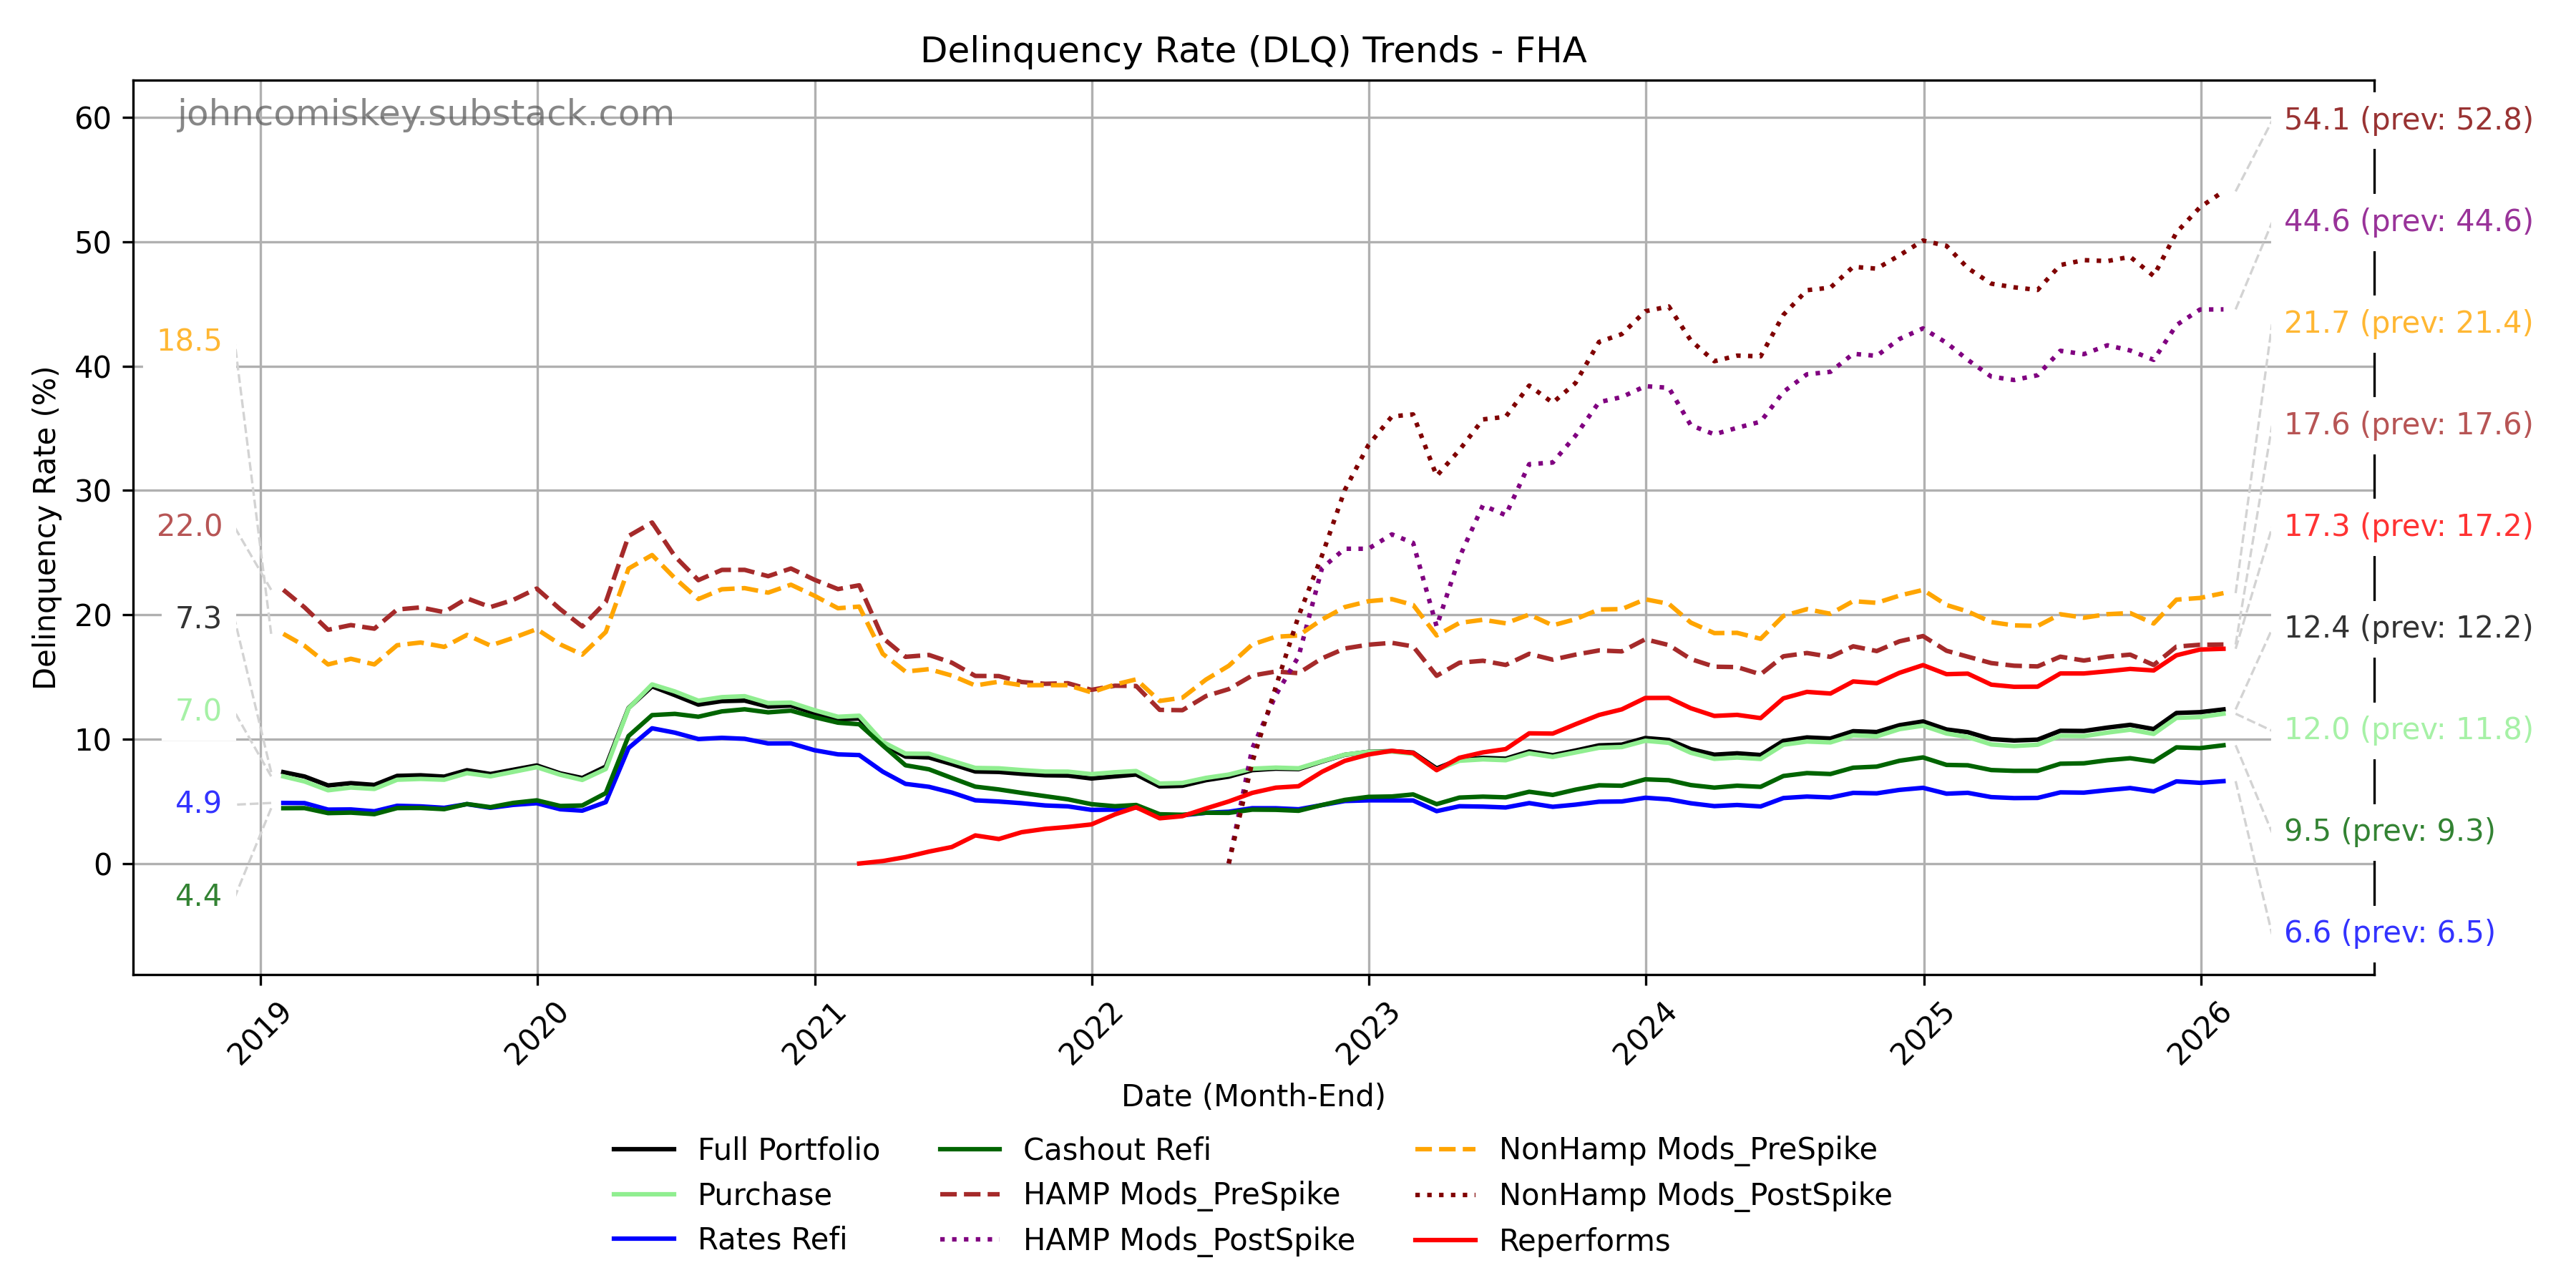
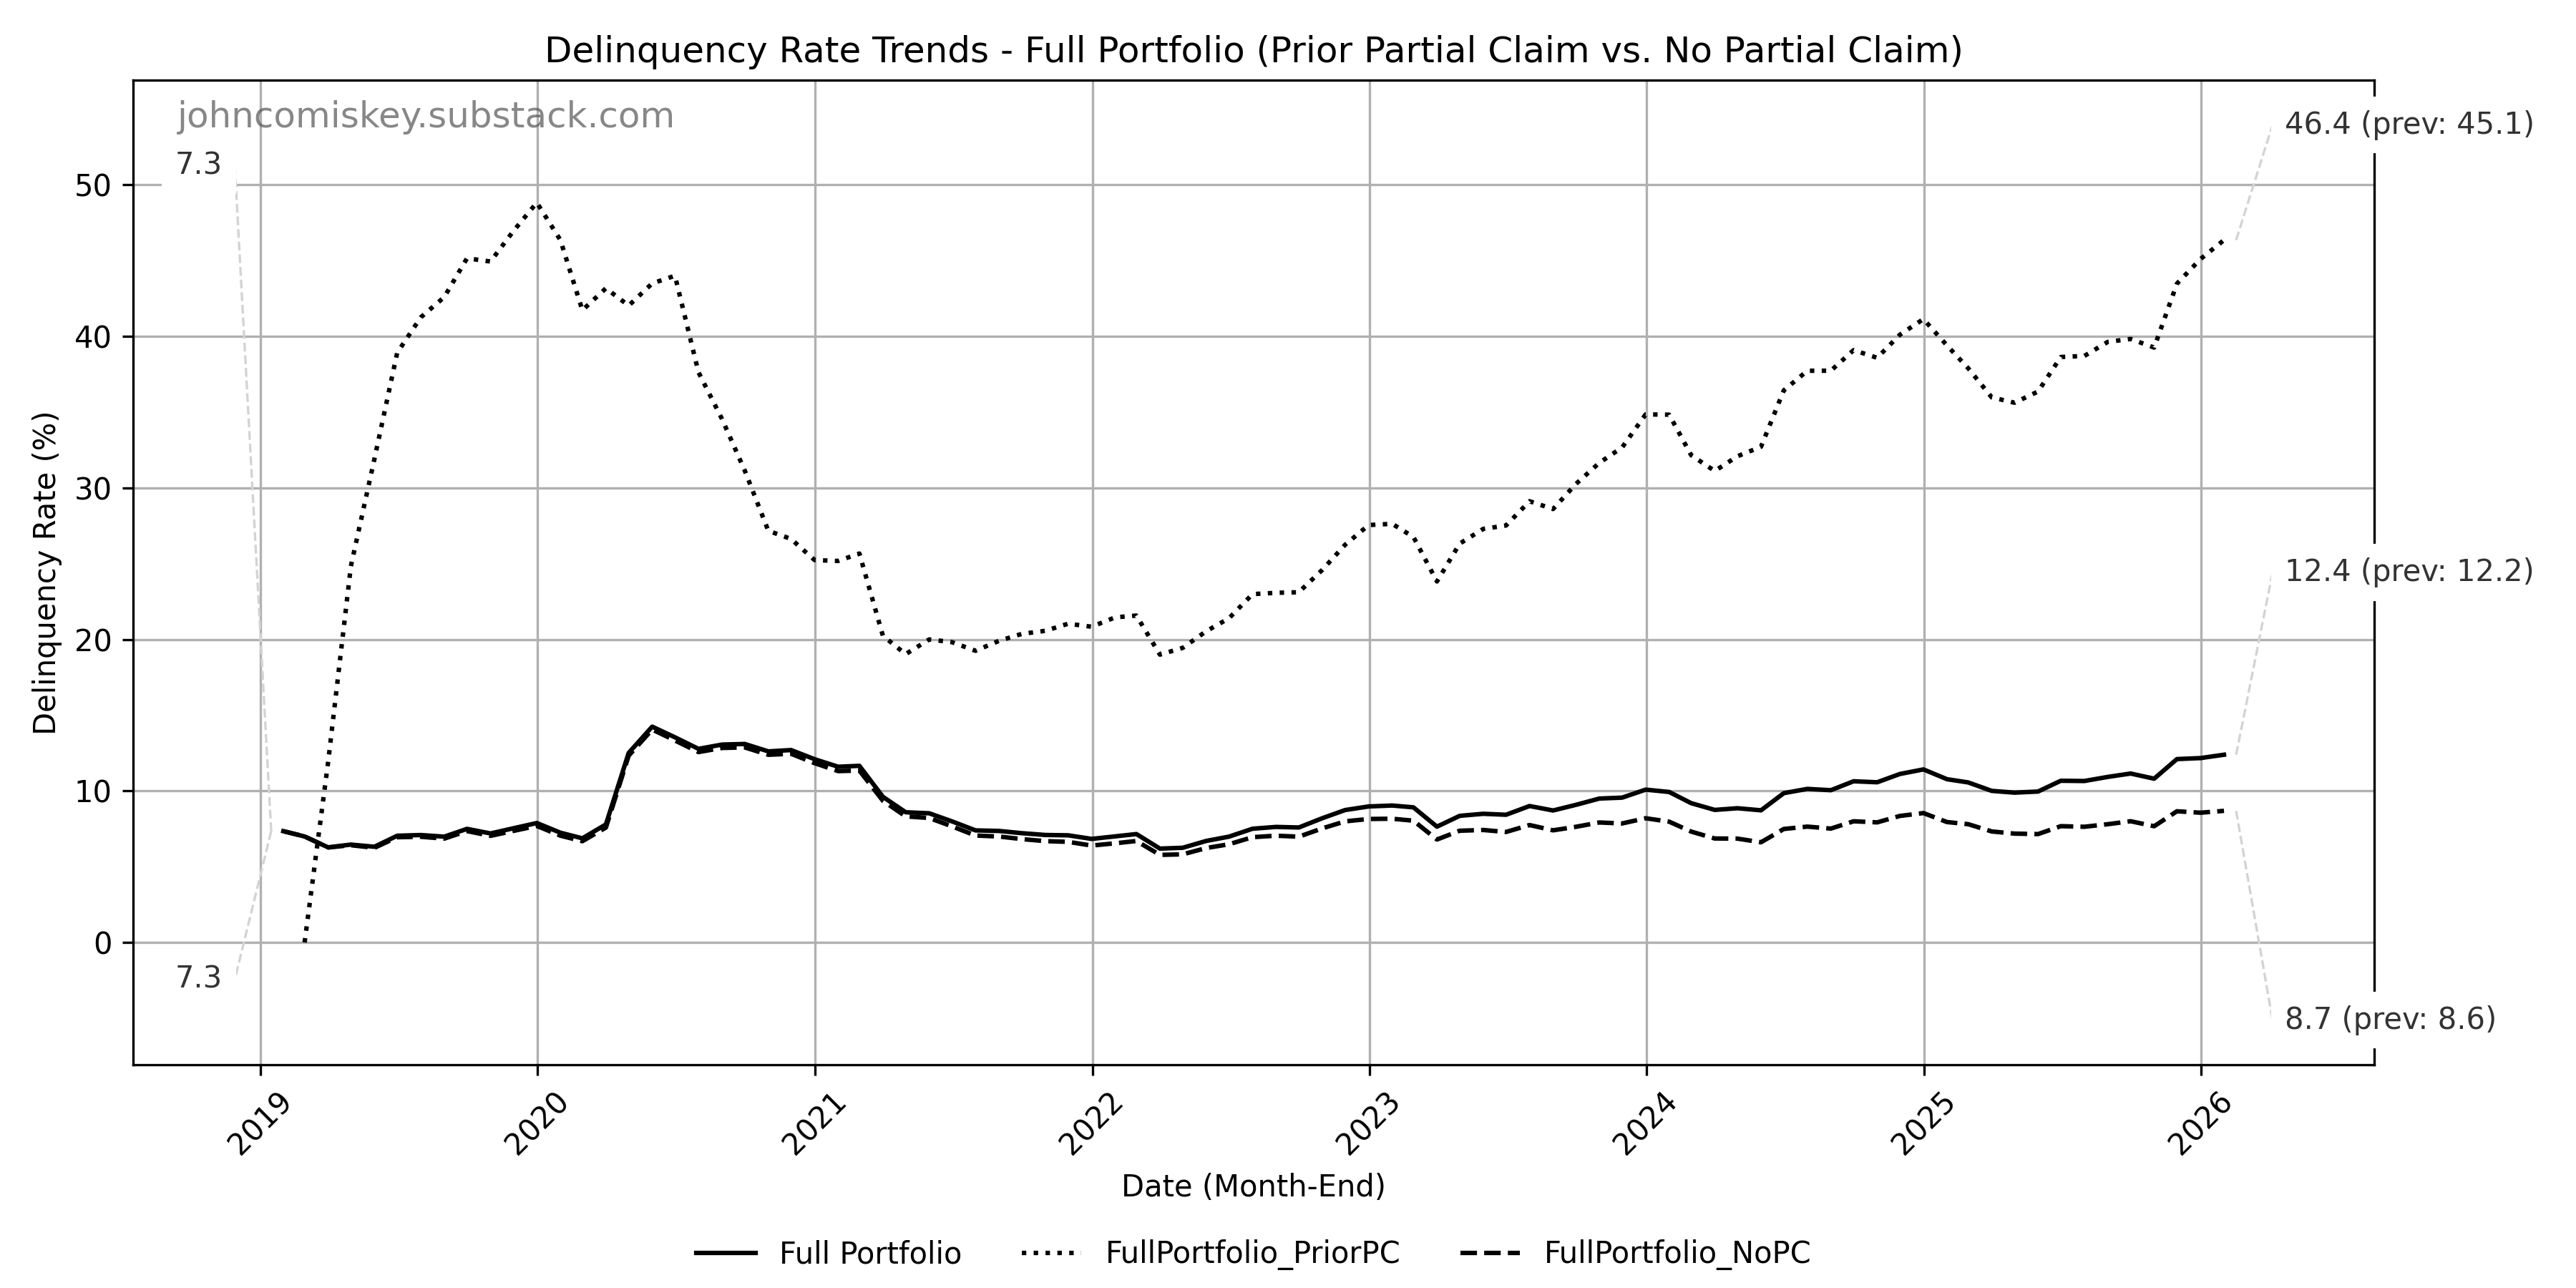
The MoM headline delinquency rates for FHAs in the GNMA II portfolio (about 7.1/8.1 million total FHAs) saw a significant increase in January rising from 12.17% in December to 12.39% in January.
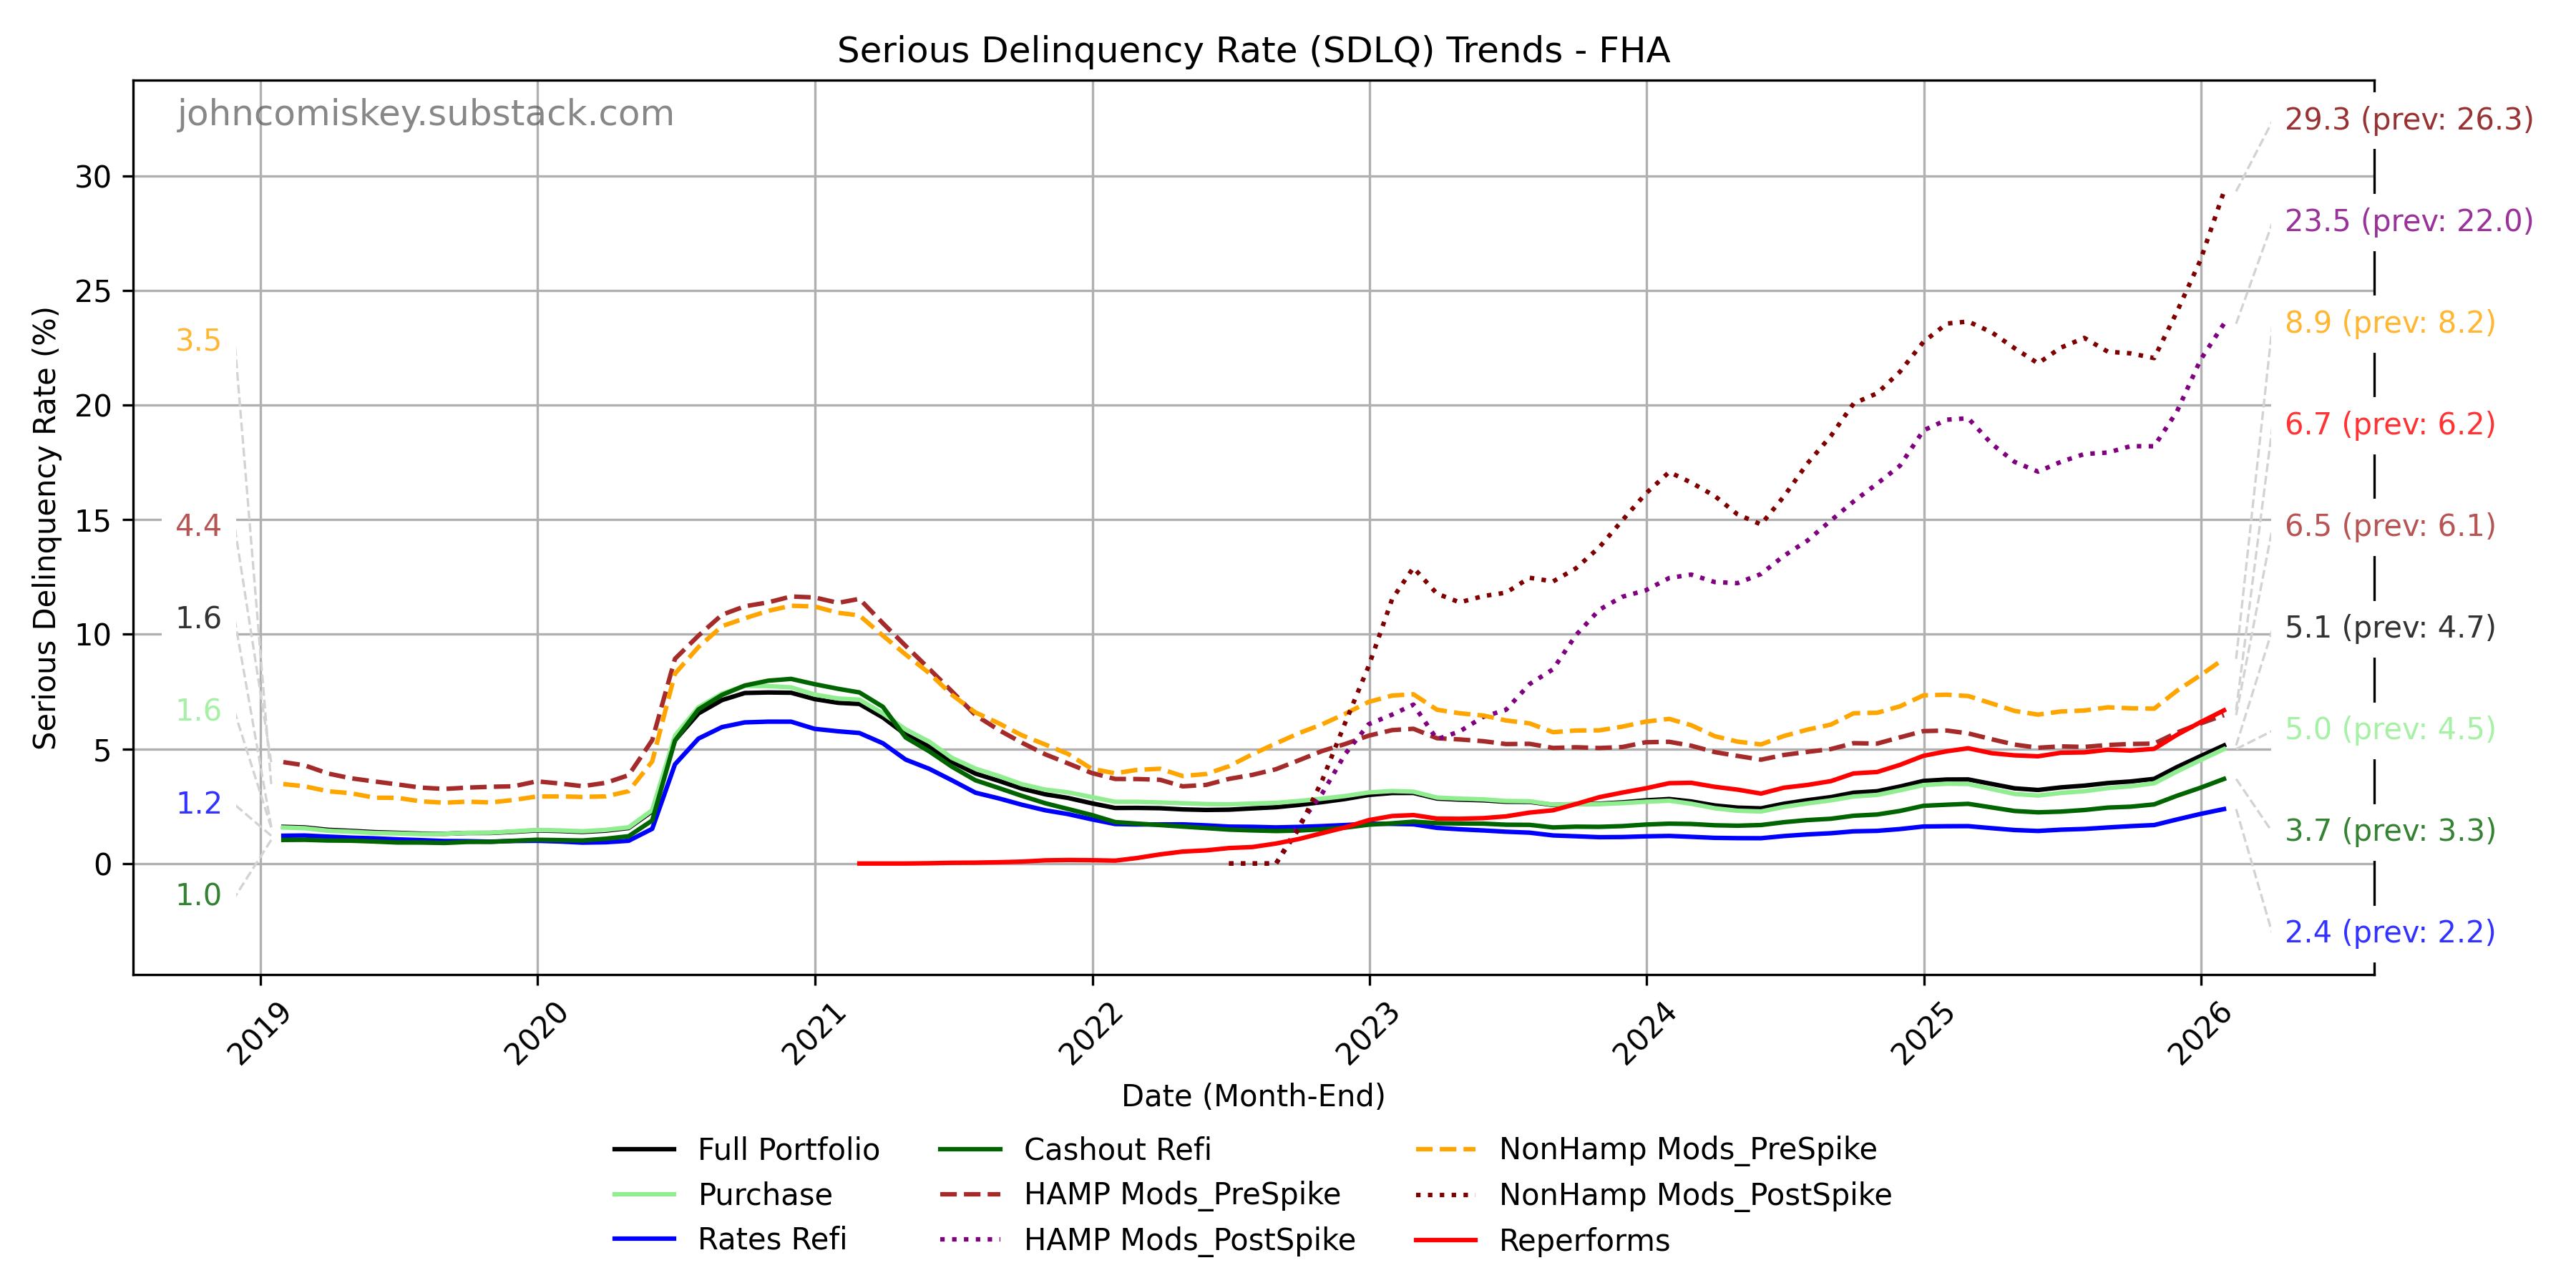
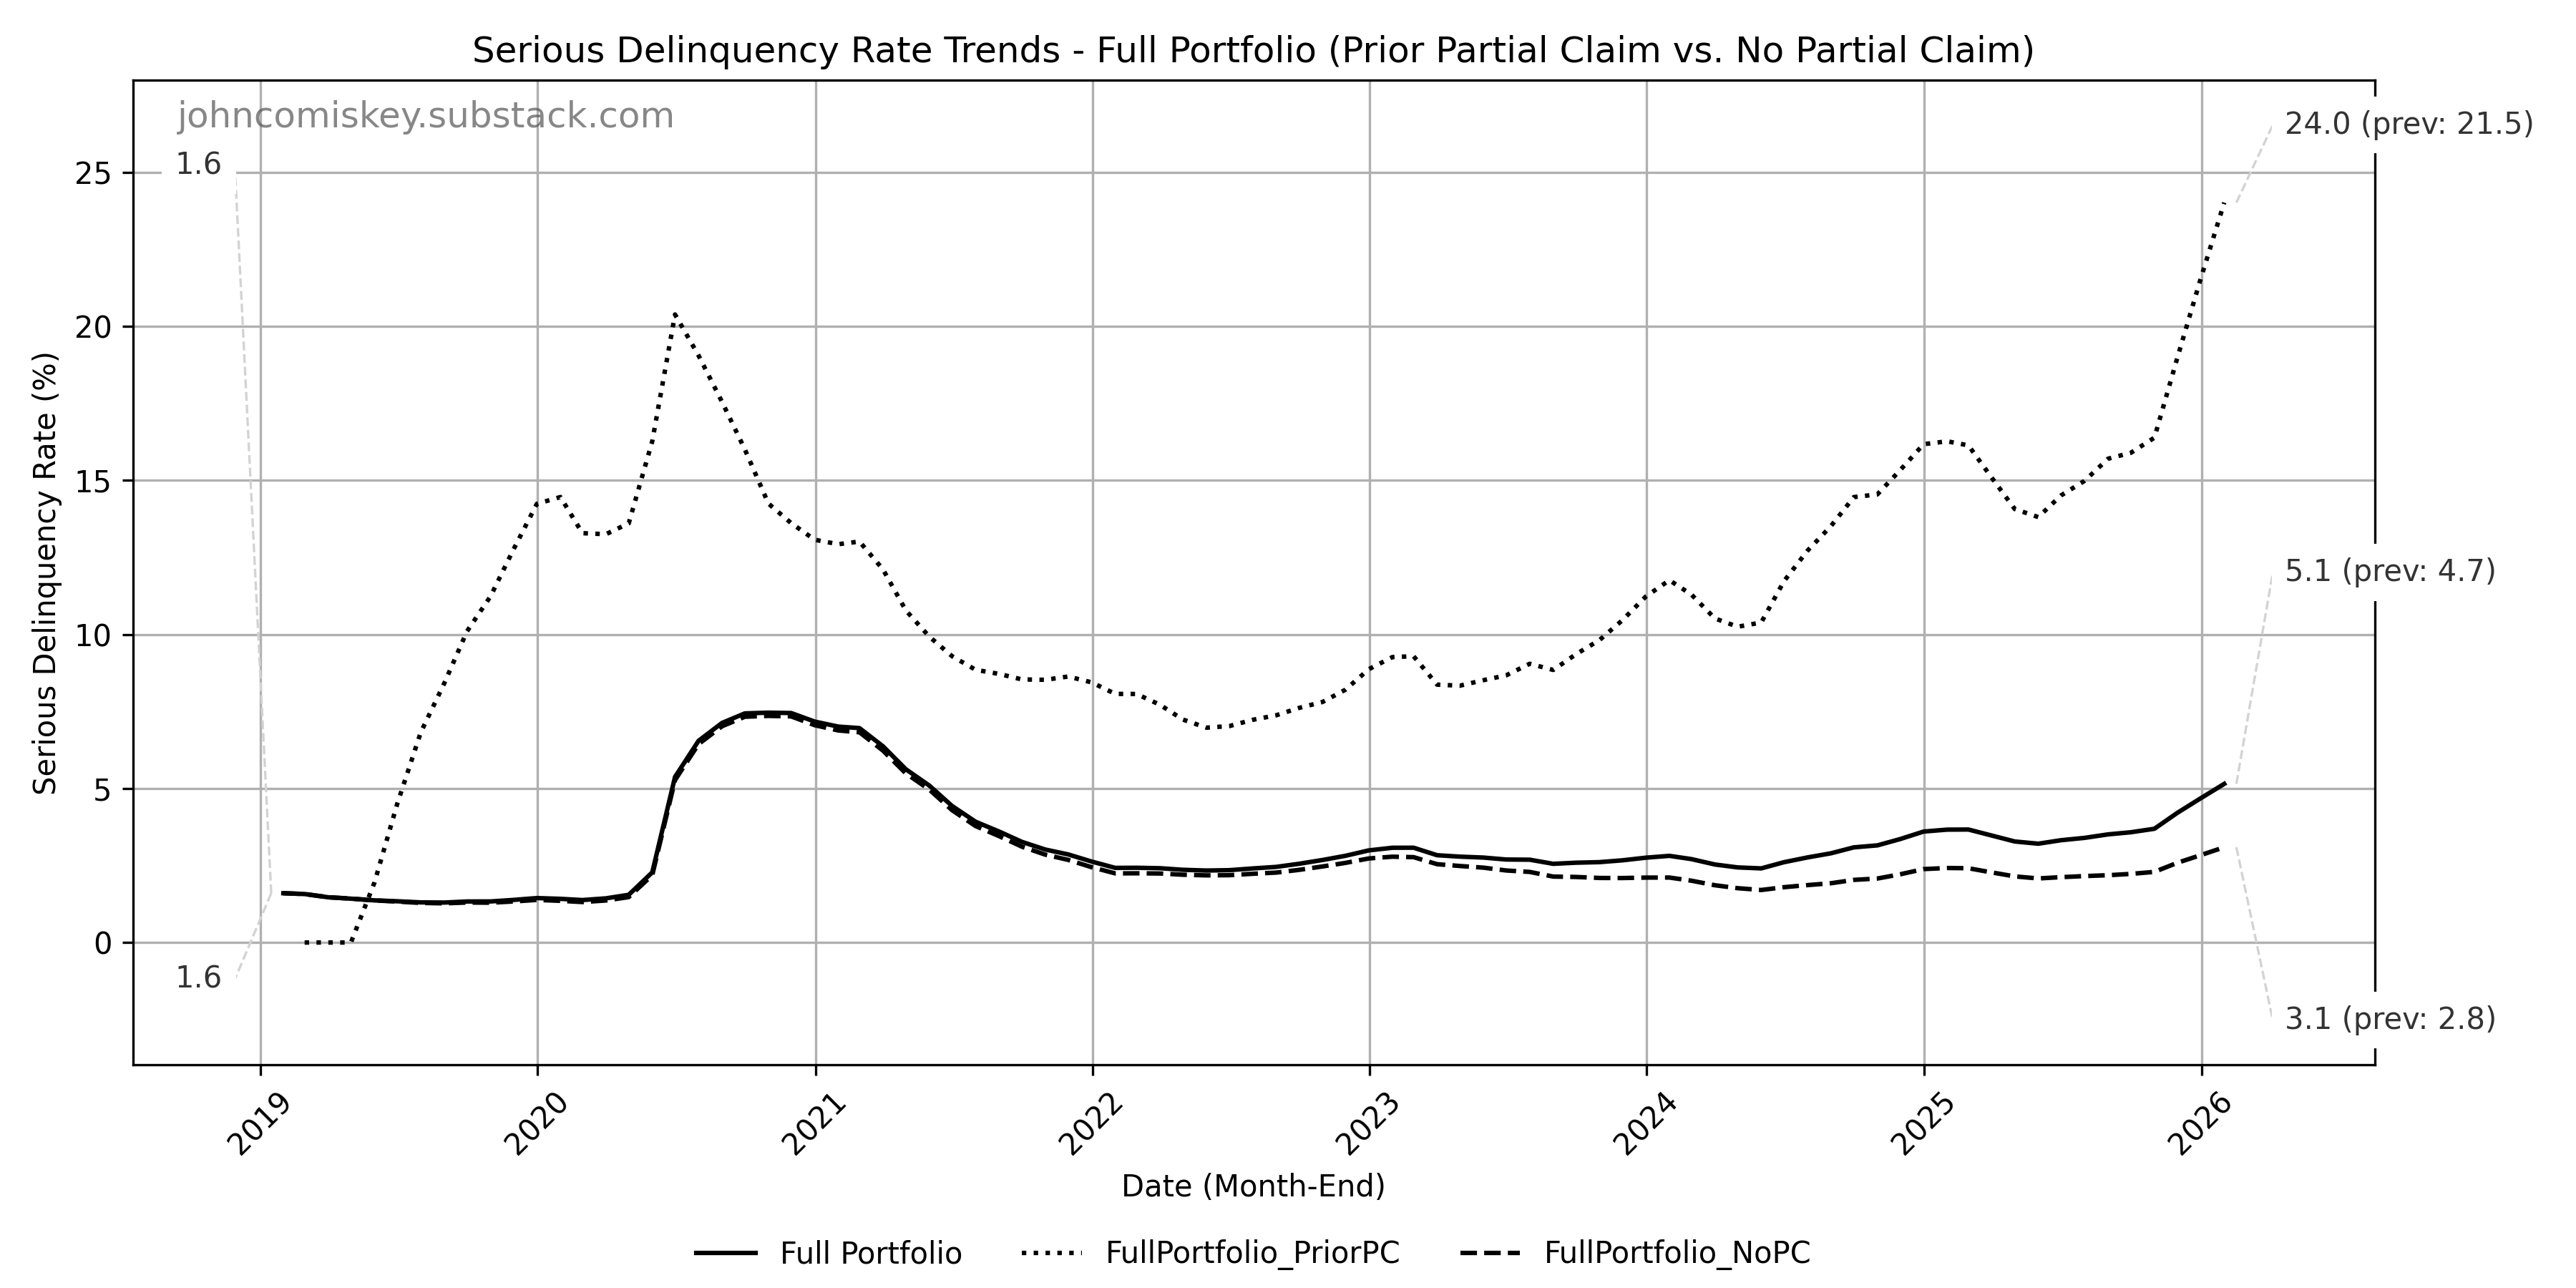
Serious delinquency rates surged higher again rising from 4.68% in December to 5.15% in January and are now almost 40% higher than where they were in October
The portfolio degradation was again concentrated in the serious delinquency. There was again improvement in the number of loans 1 month late which is consistent with seasonality for this time of year, loans 2 months late also improved. Loans 3 or more months late however all showed continued degradation, which got worse the more delinquent the loan was. This degradation is very much tied to the inability for loss mitigation workouts to “cure” the loan right now because of the requirement of 3 trial payments.
I wrote this in last months update which was a pretty accurate projection of what was going to happen this month.
“Looking to next month…. seasonally there is a tendency for small declines December → January in the 1 month late and 2 months late portions of the portfolio. Regardless, the DLQ rate will likely rise because the partial claims and loan modifications (the ones that actually prove successful) will need another month for Trial Payment Plans to complete before they can start “curing” serious delinquencies in the data again. Serious DLQ will likely see another 45-50bp rise and should end January at over 5% SDLQ.”
February is harder to project. Seasonally there is a tendency for declines in DLQ , particularly in the 1 and 2 month late cohorts through May, before a spike in June through the end of the year. Mostly the same story with SDLQ. But this year is not a usual year since this February marks the first month where trial payment plans can be completed and loss mitigation workouts can reflect in the data (by bringing the loans current) under the new procedures. Industry sources tell me they expect roughly 50% success/fail rates on the TPPs. The February data will give a good read on what the actual rate will be but whatever it ends up being, improvement in both DLQ and SDLQ is expected. How much is the key question.
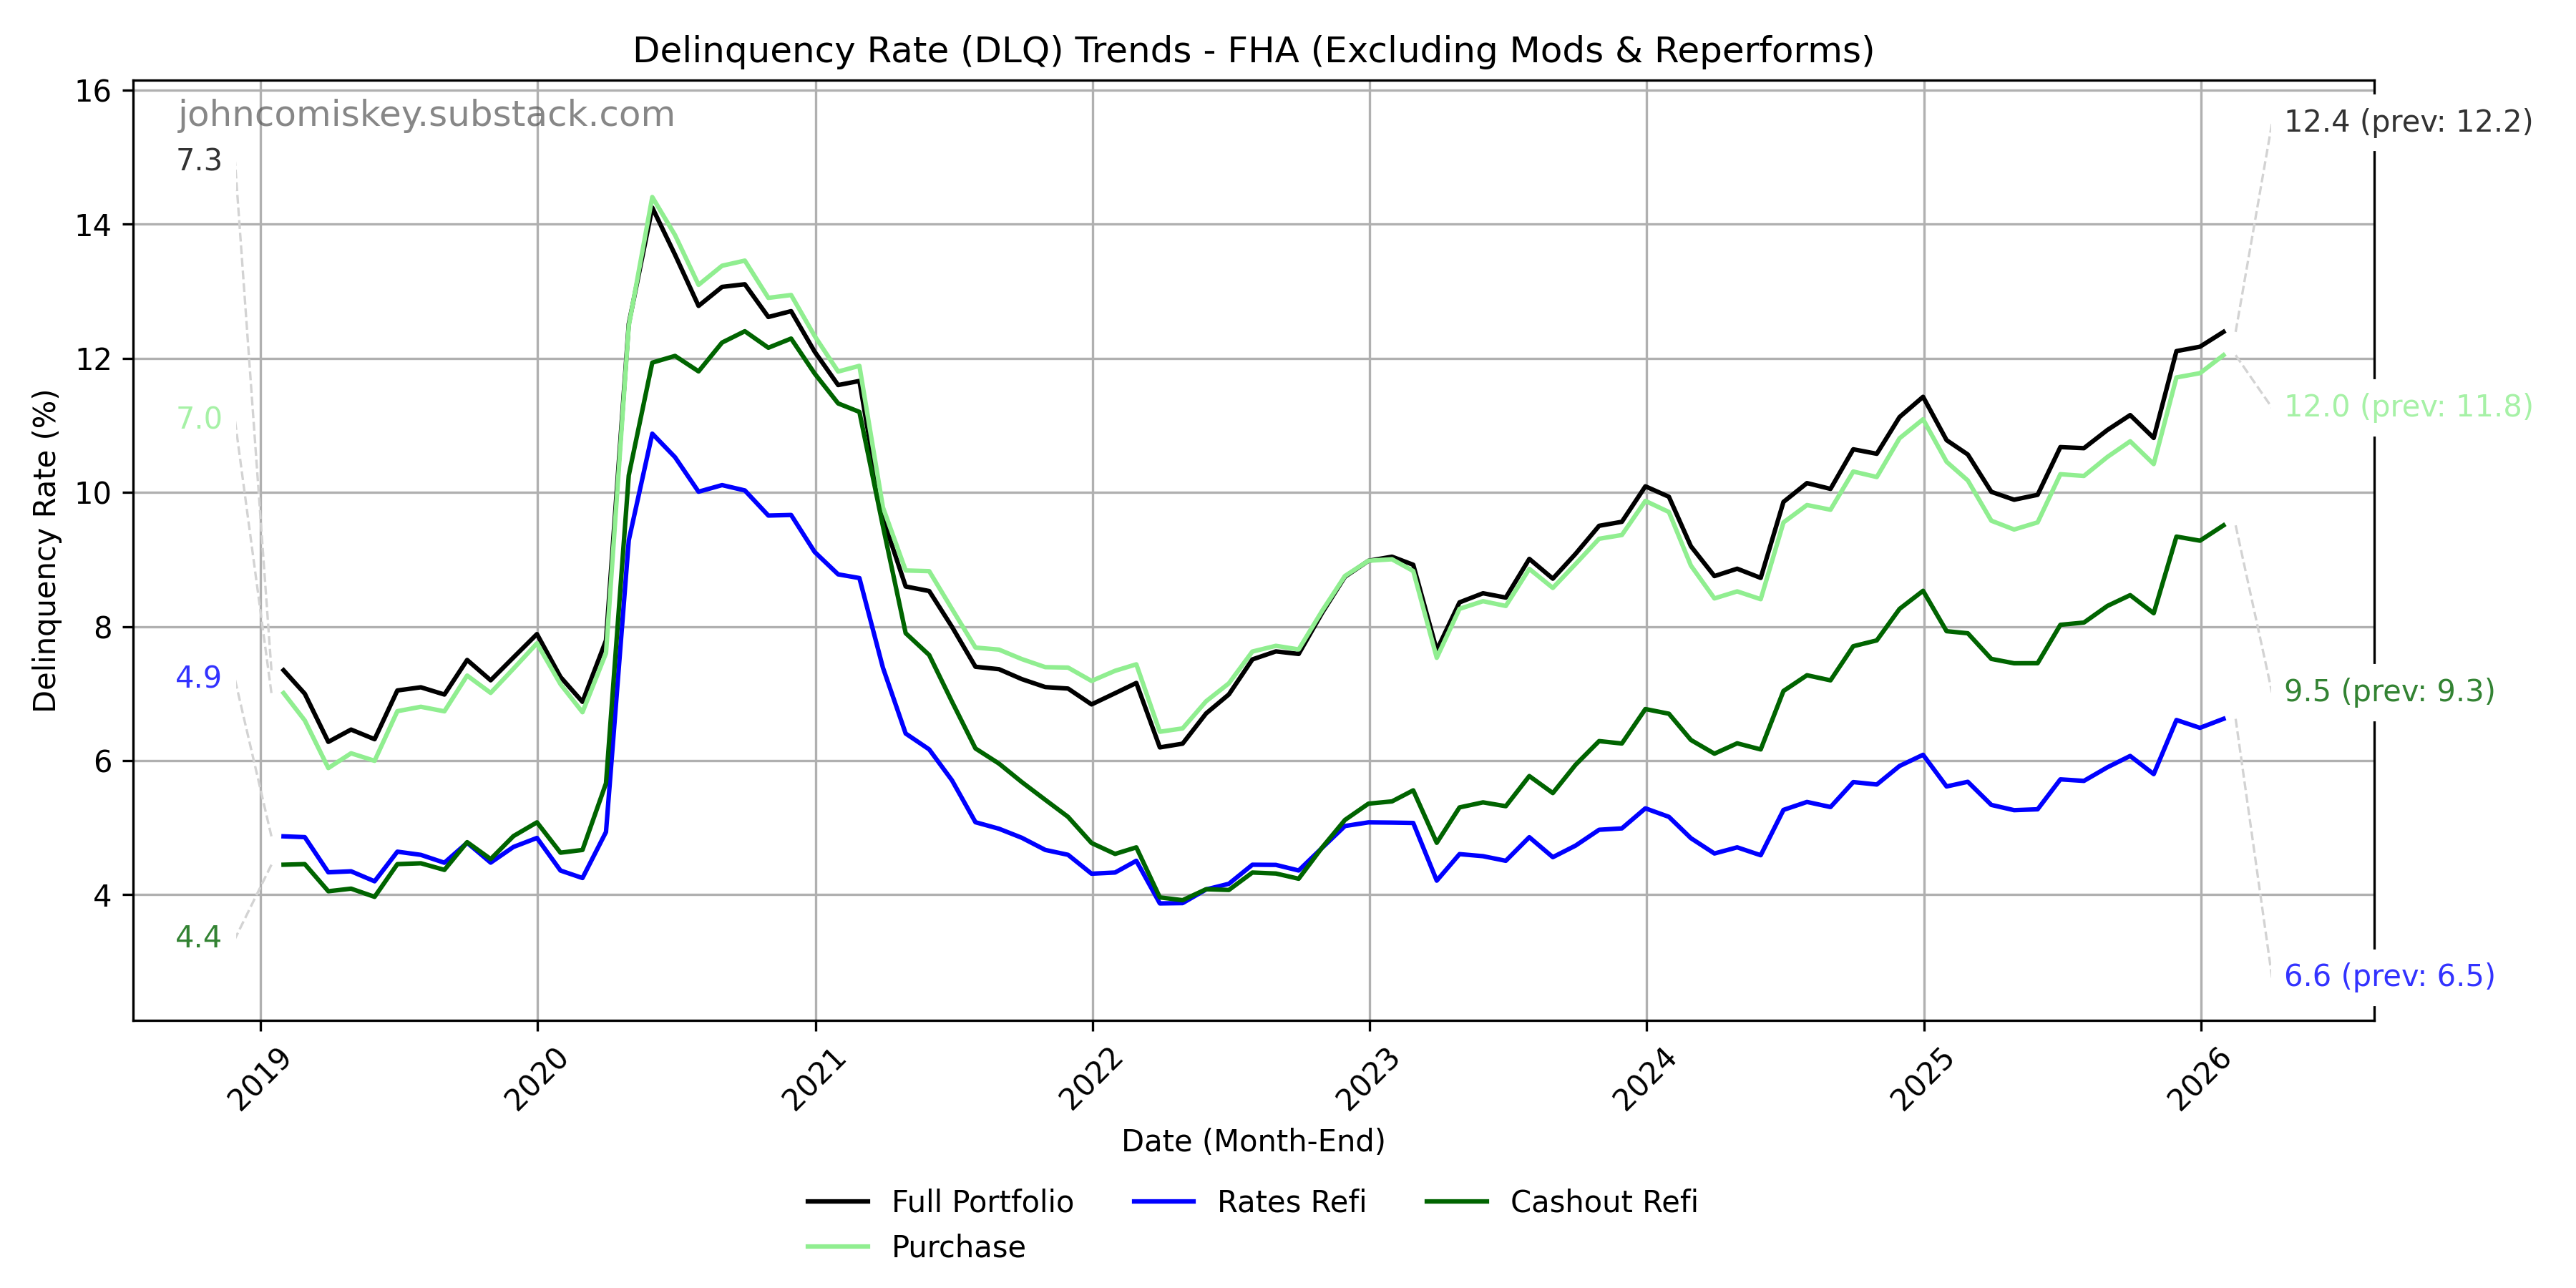
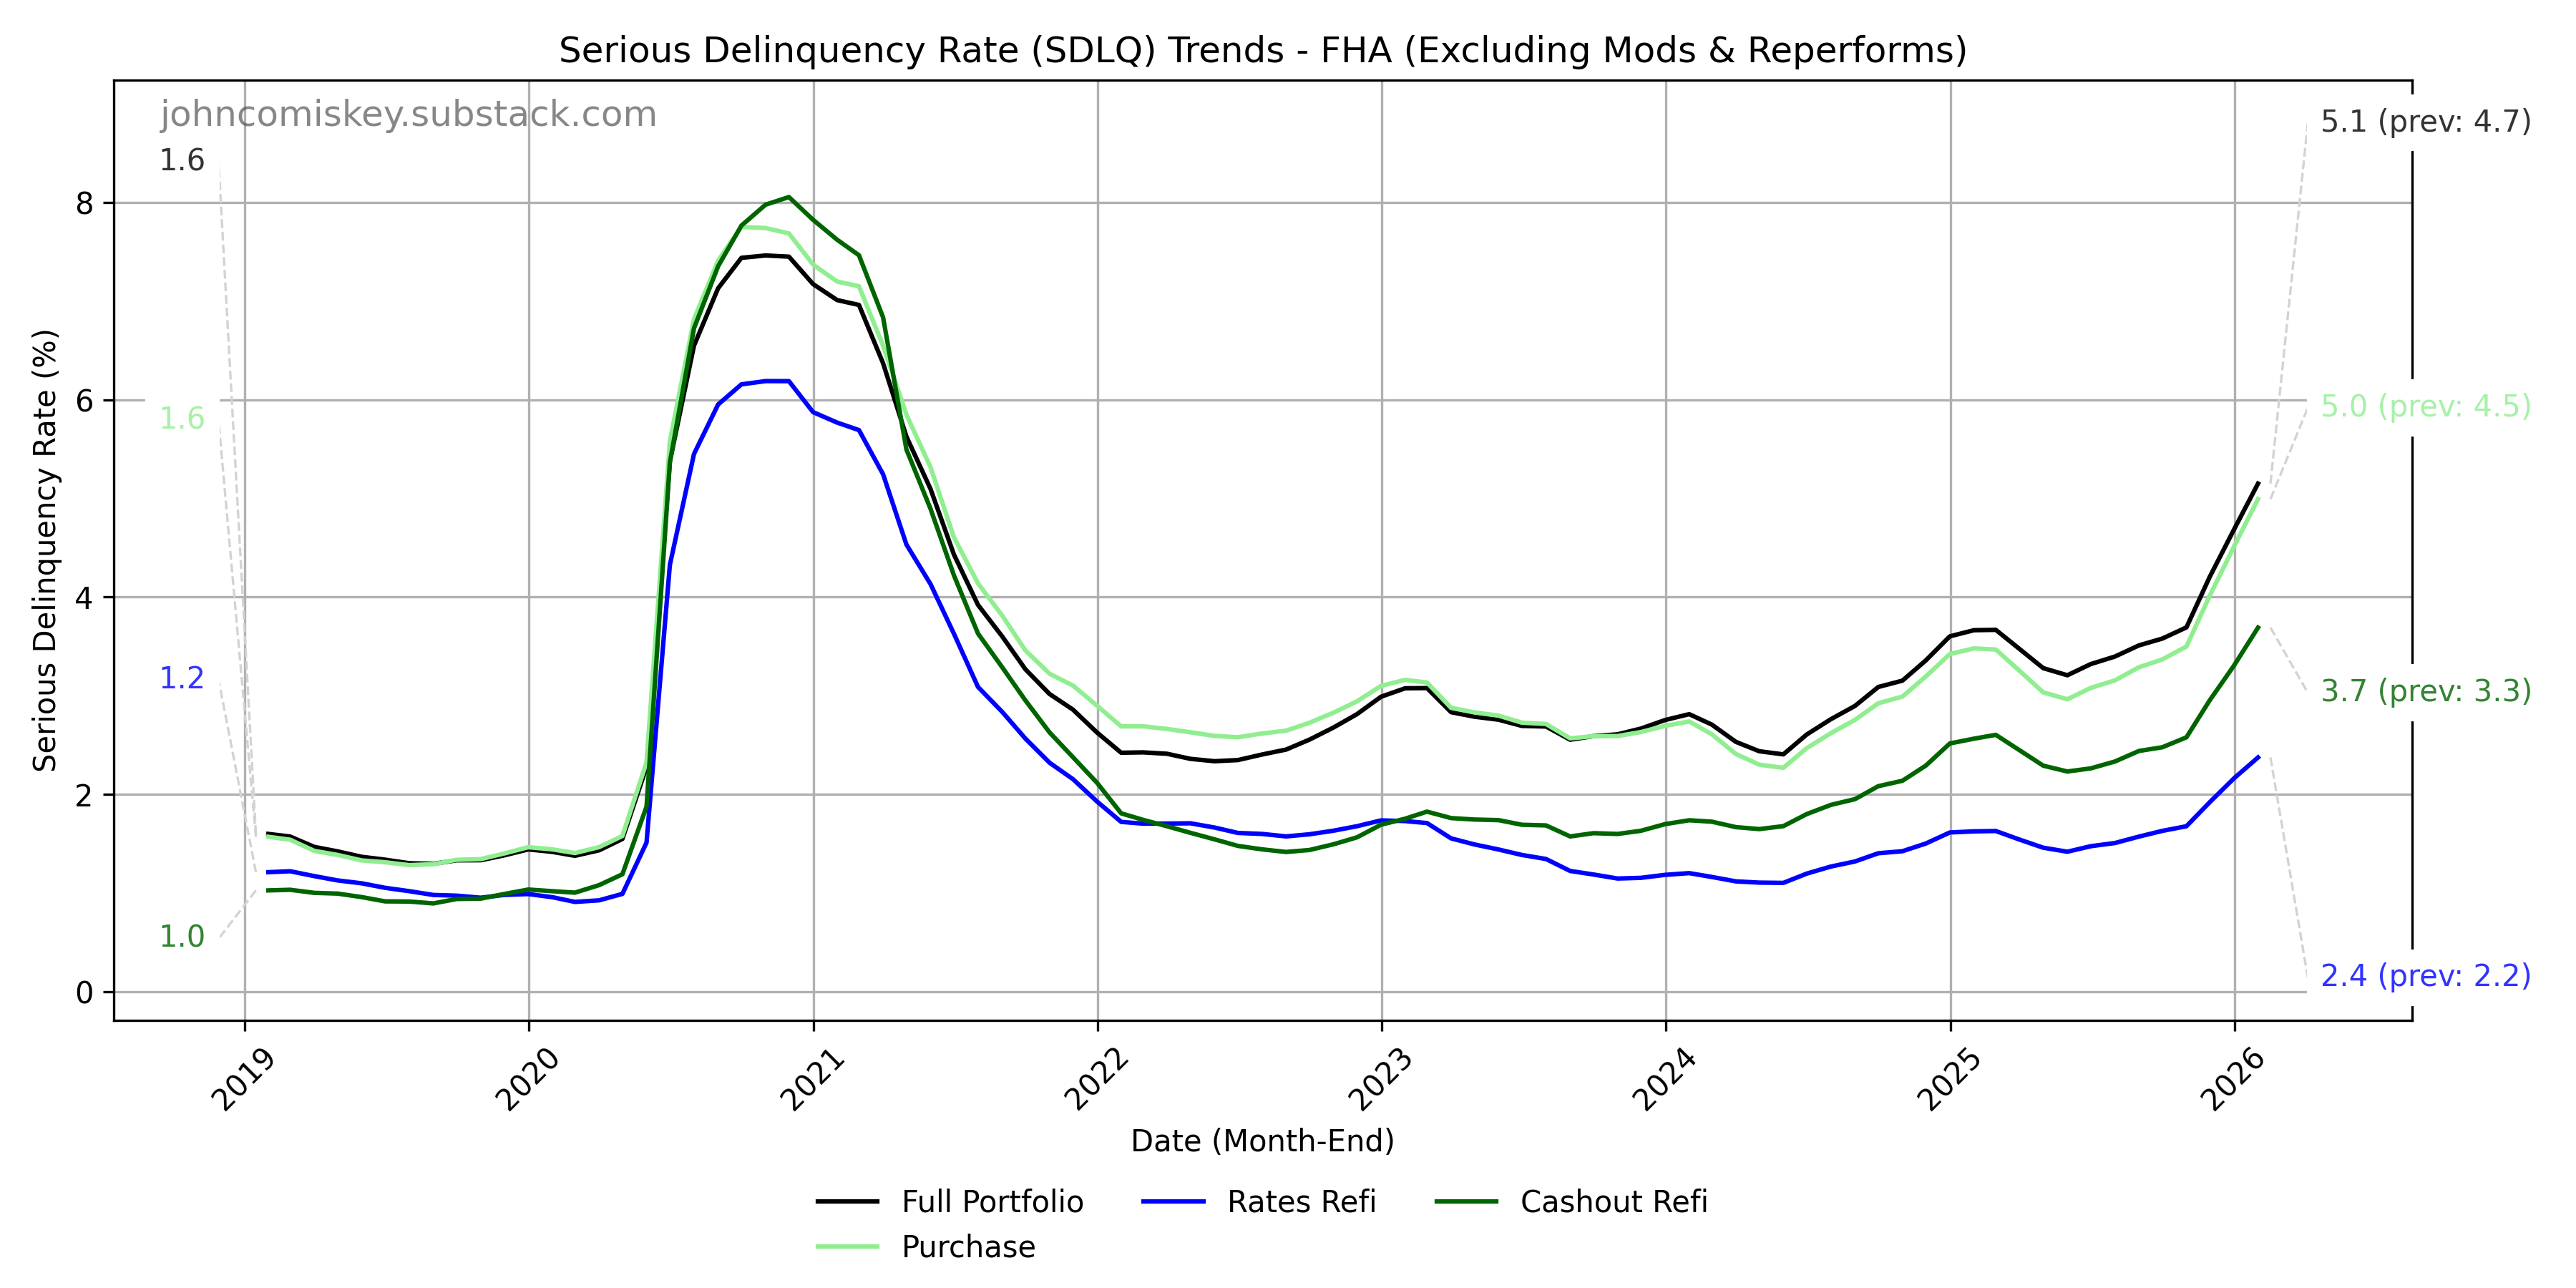
January FHA GNMA II MBS Performance Charts - Full Portfolio (excluding mods/reperforms so the scale doesn’t skew)
DLQ up significantly , SDLQ up huge. Almost certainly the high water mark for the season, possibly for the cycle.
Modifications and Reperforms
The Modifications of Doom, the modifications performed since mid 2022, again saw worsening performance with no partial claims or loan modifications available to “cure” loans. 54.1% delinquent and 29.3% serious delinquent speaks for itself. As mentioned last month, this performance significantly understates just how bad the performance really has been since many of the modifications that were originated during this period have already been removed from the MBS pools due for delinquency mgmt purposes or further loan mods. When all is said and done, the success/fail rate on these modifications is going to be scandalous (already is). FHA loans are a big program and the losses to the taxpayer here are likely more than offset by profits on the up front and monthly mortgage insurance payments but thats no excuse for the magnitude of the policy mistake on these modifications.
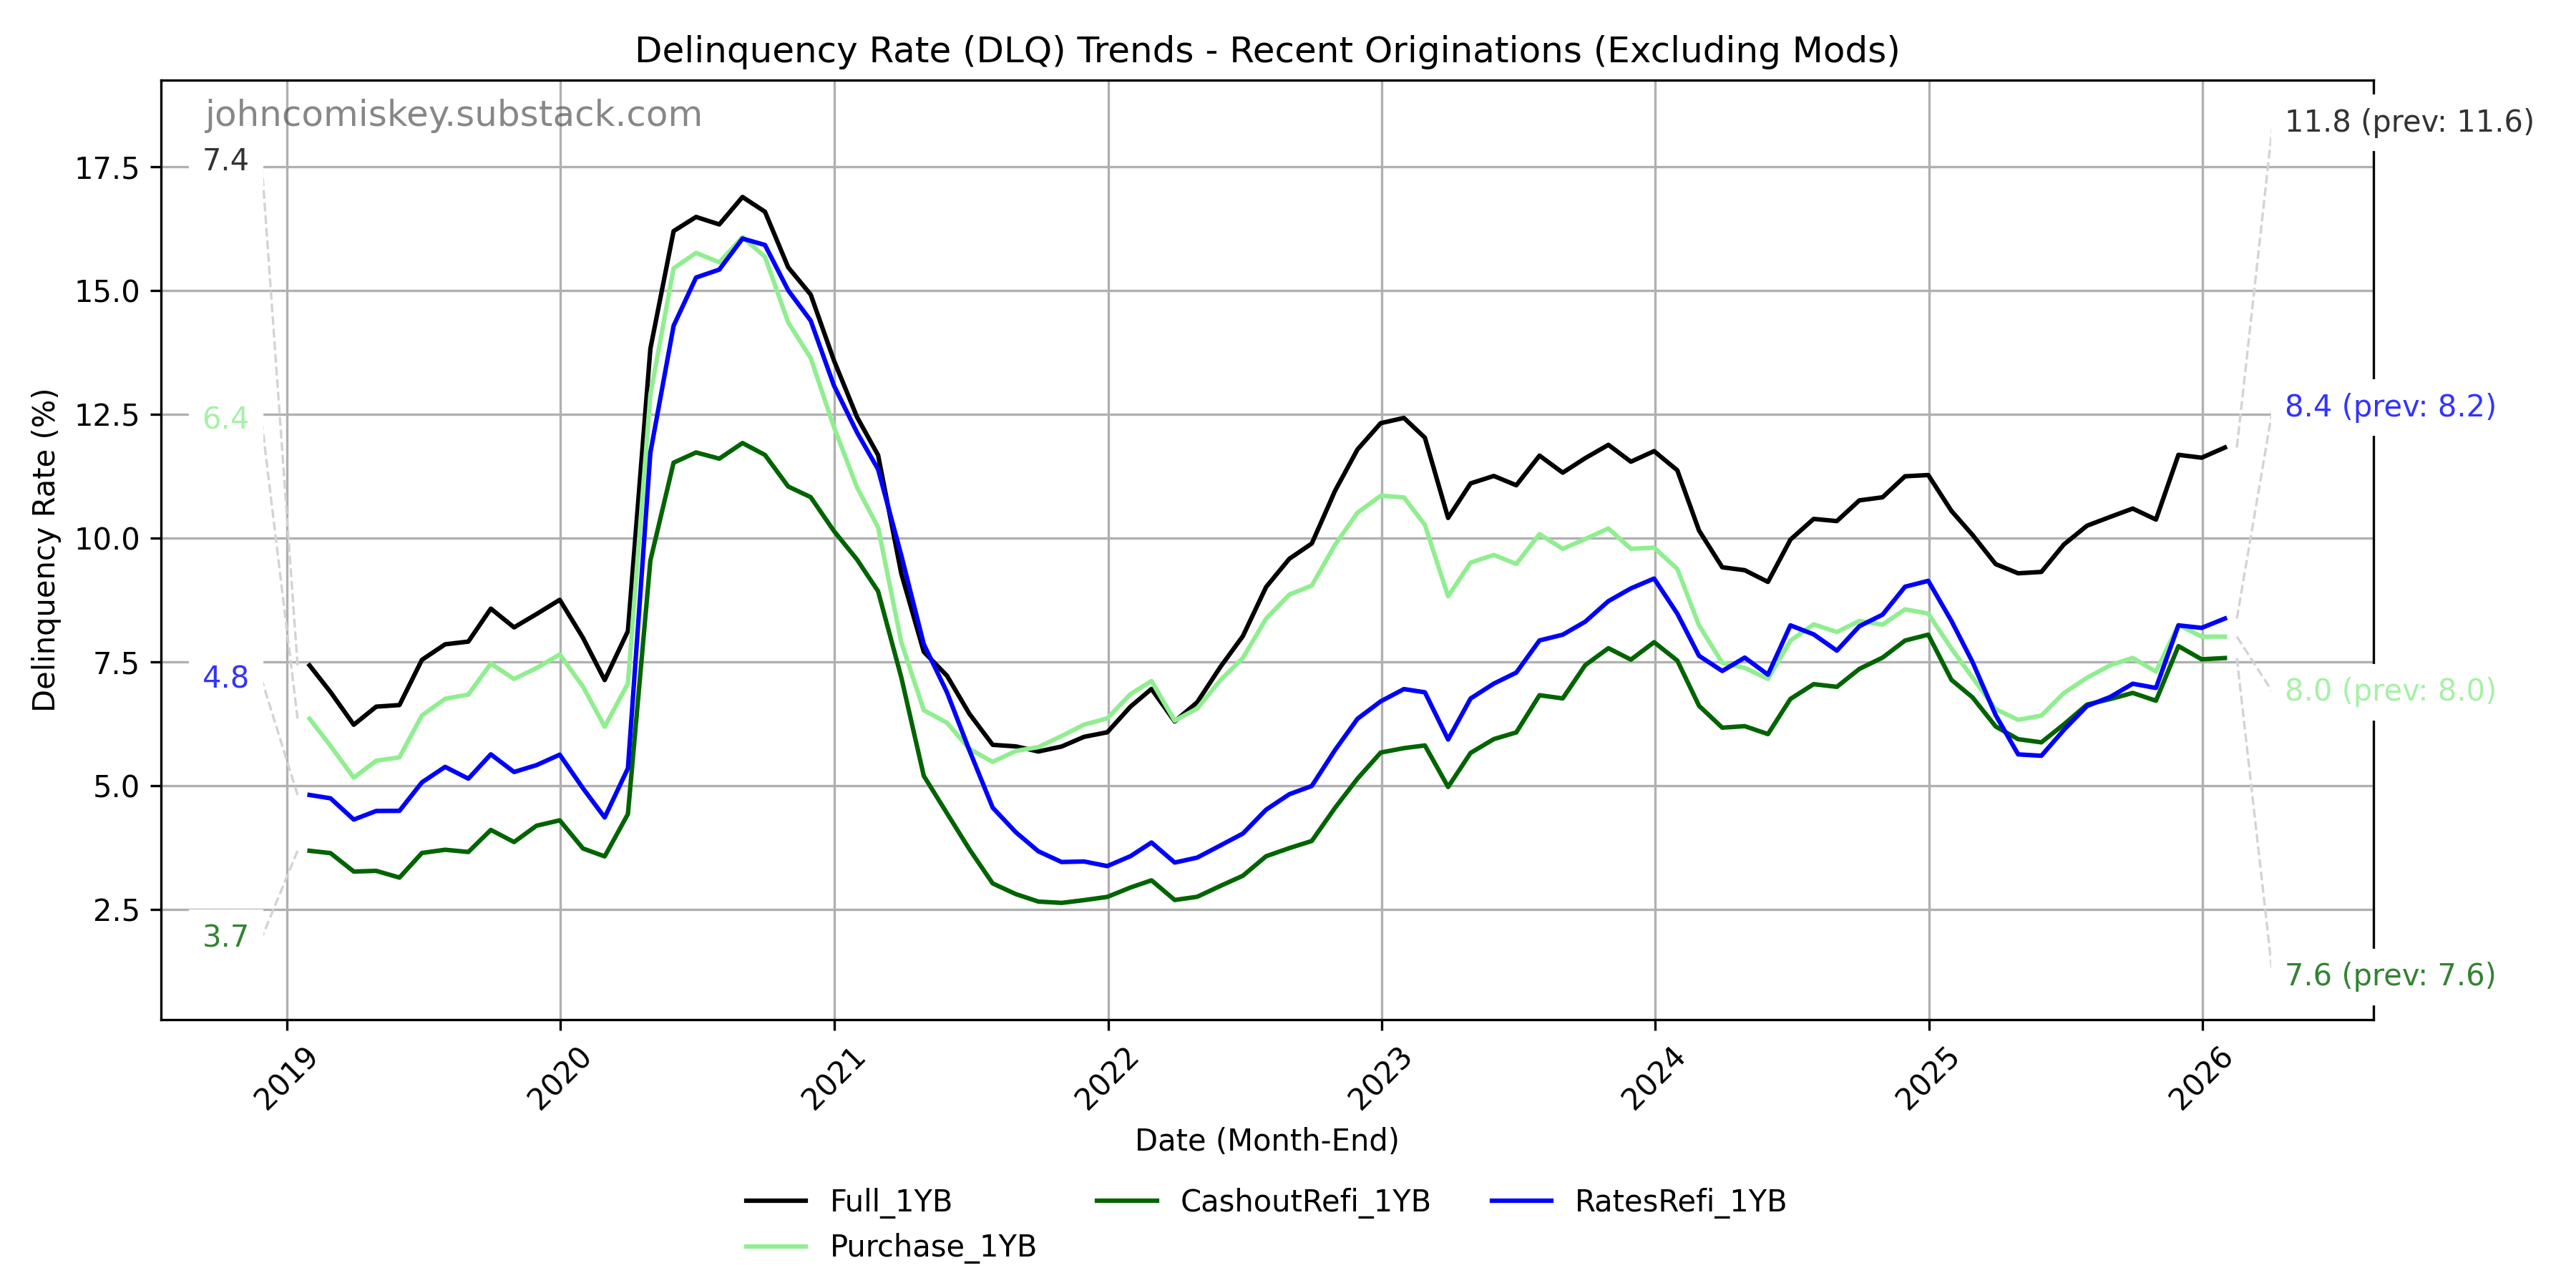
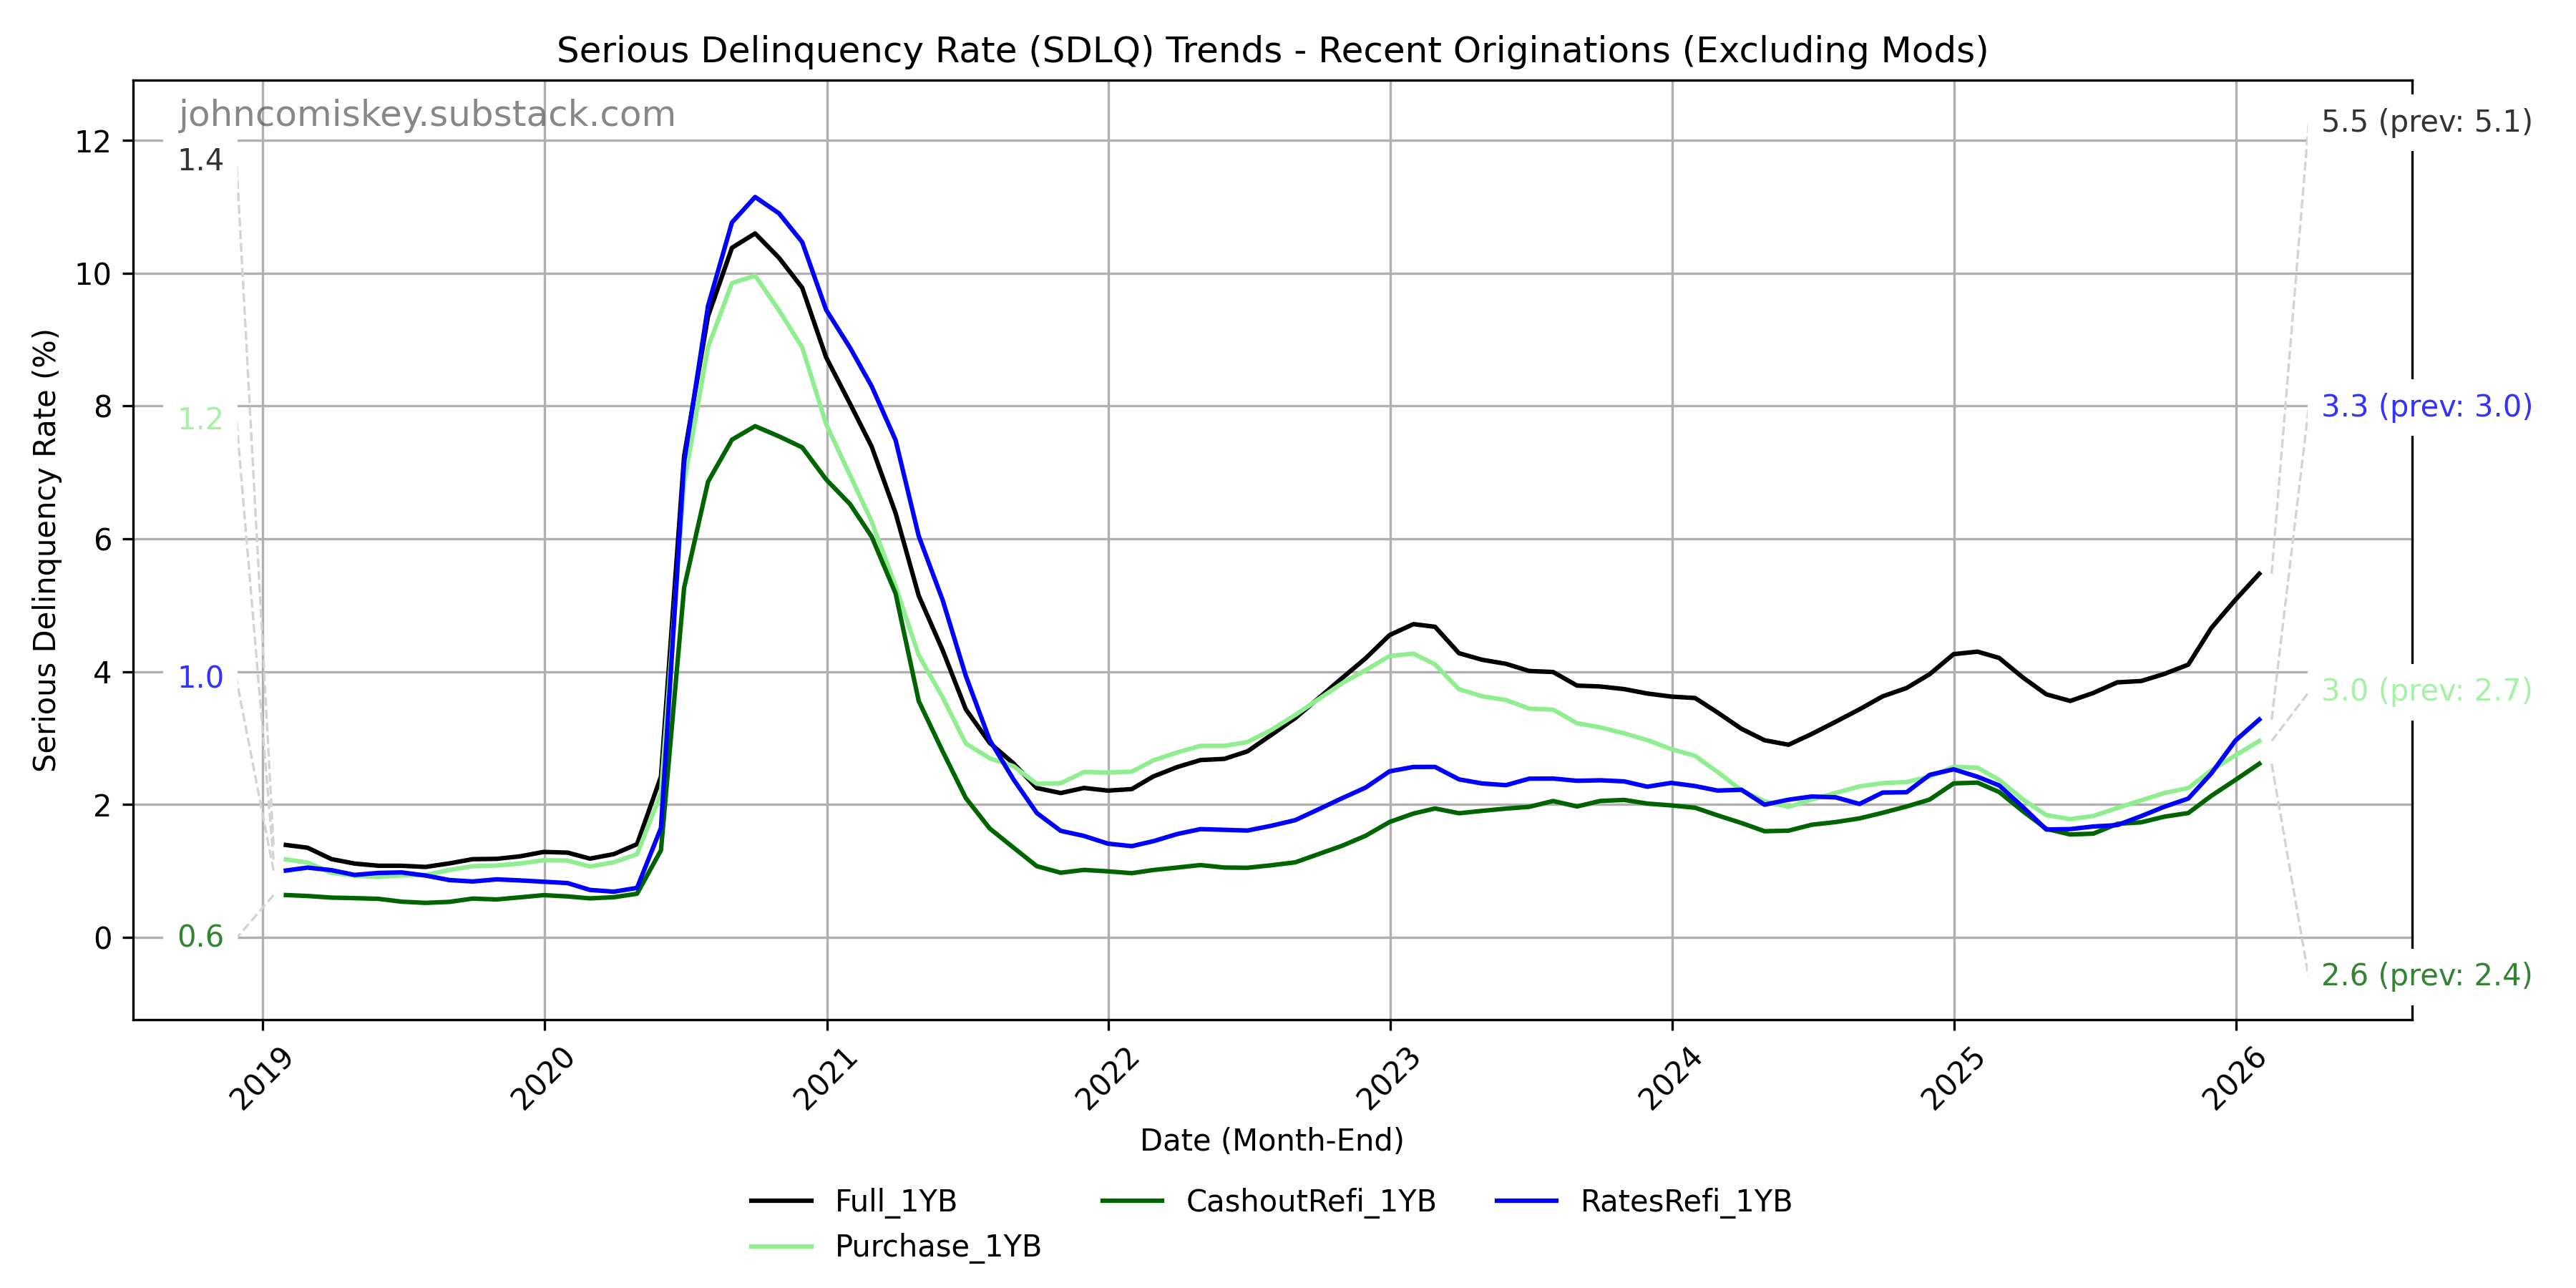
January FHA Recent Originations Charts
Recent originations (between 3 and 15 months ago) also saw rises in DLQ and SDLQ though the DLQ rises were in recent rates refinances and recently originated mods. Outside of recently originated mods (which includes many of the mods of doom) the recently originated mortgages continue to perform better then the full FHA portfolio
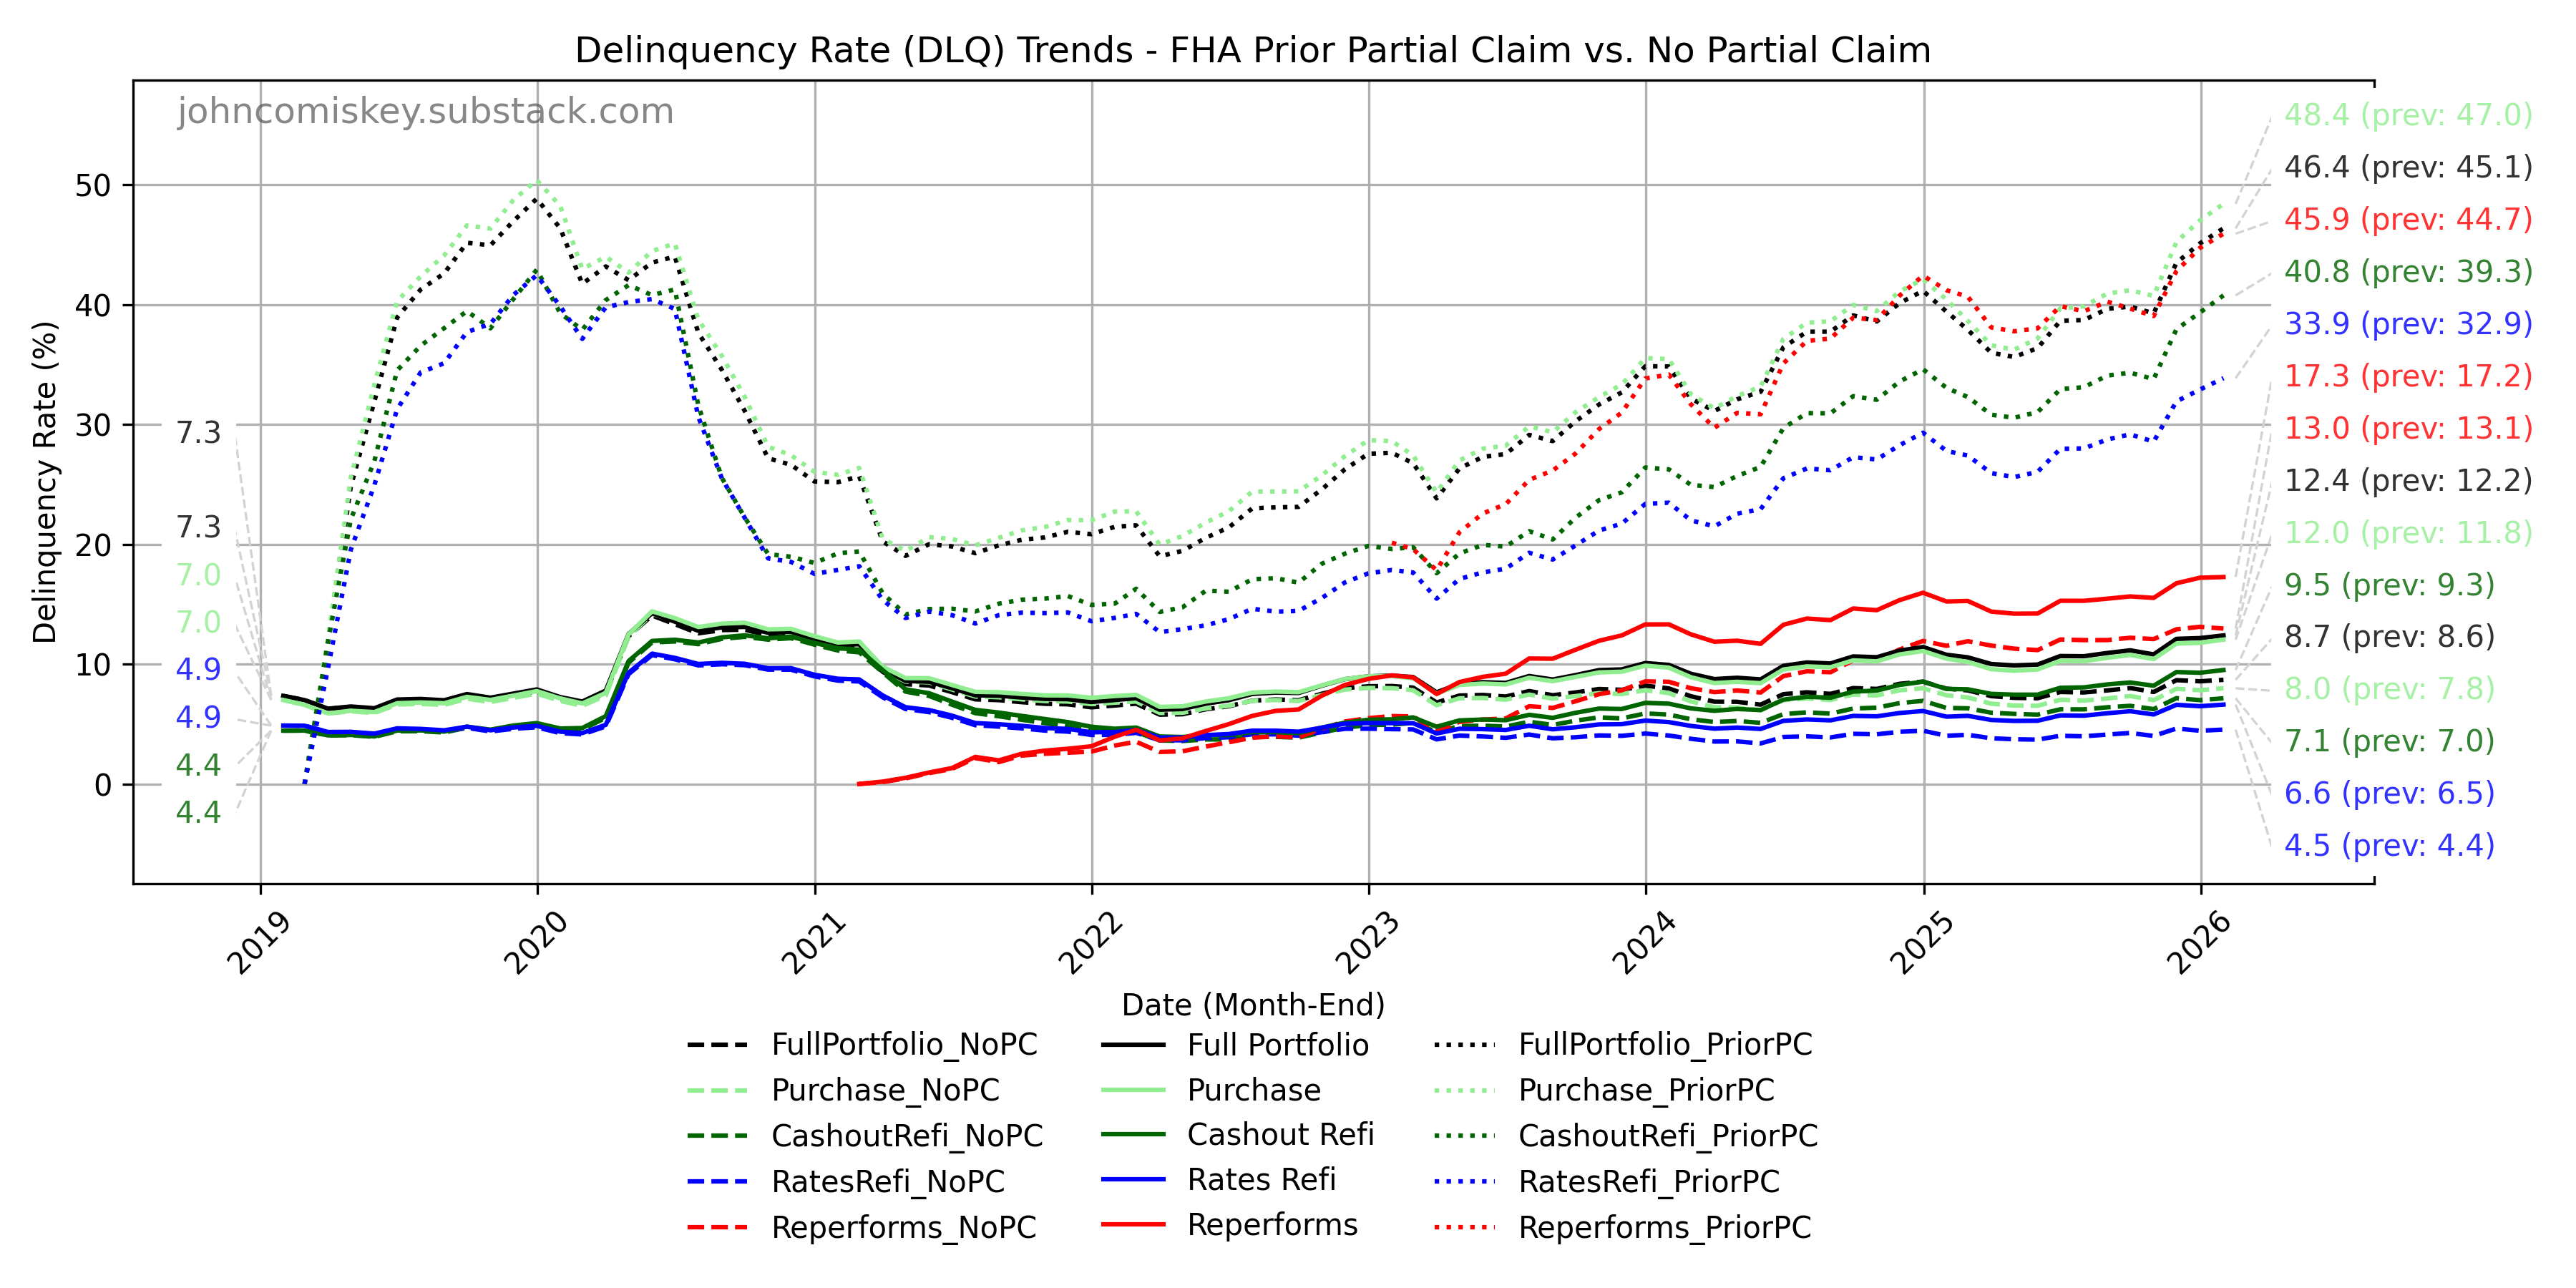
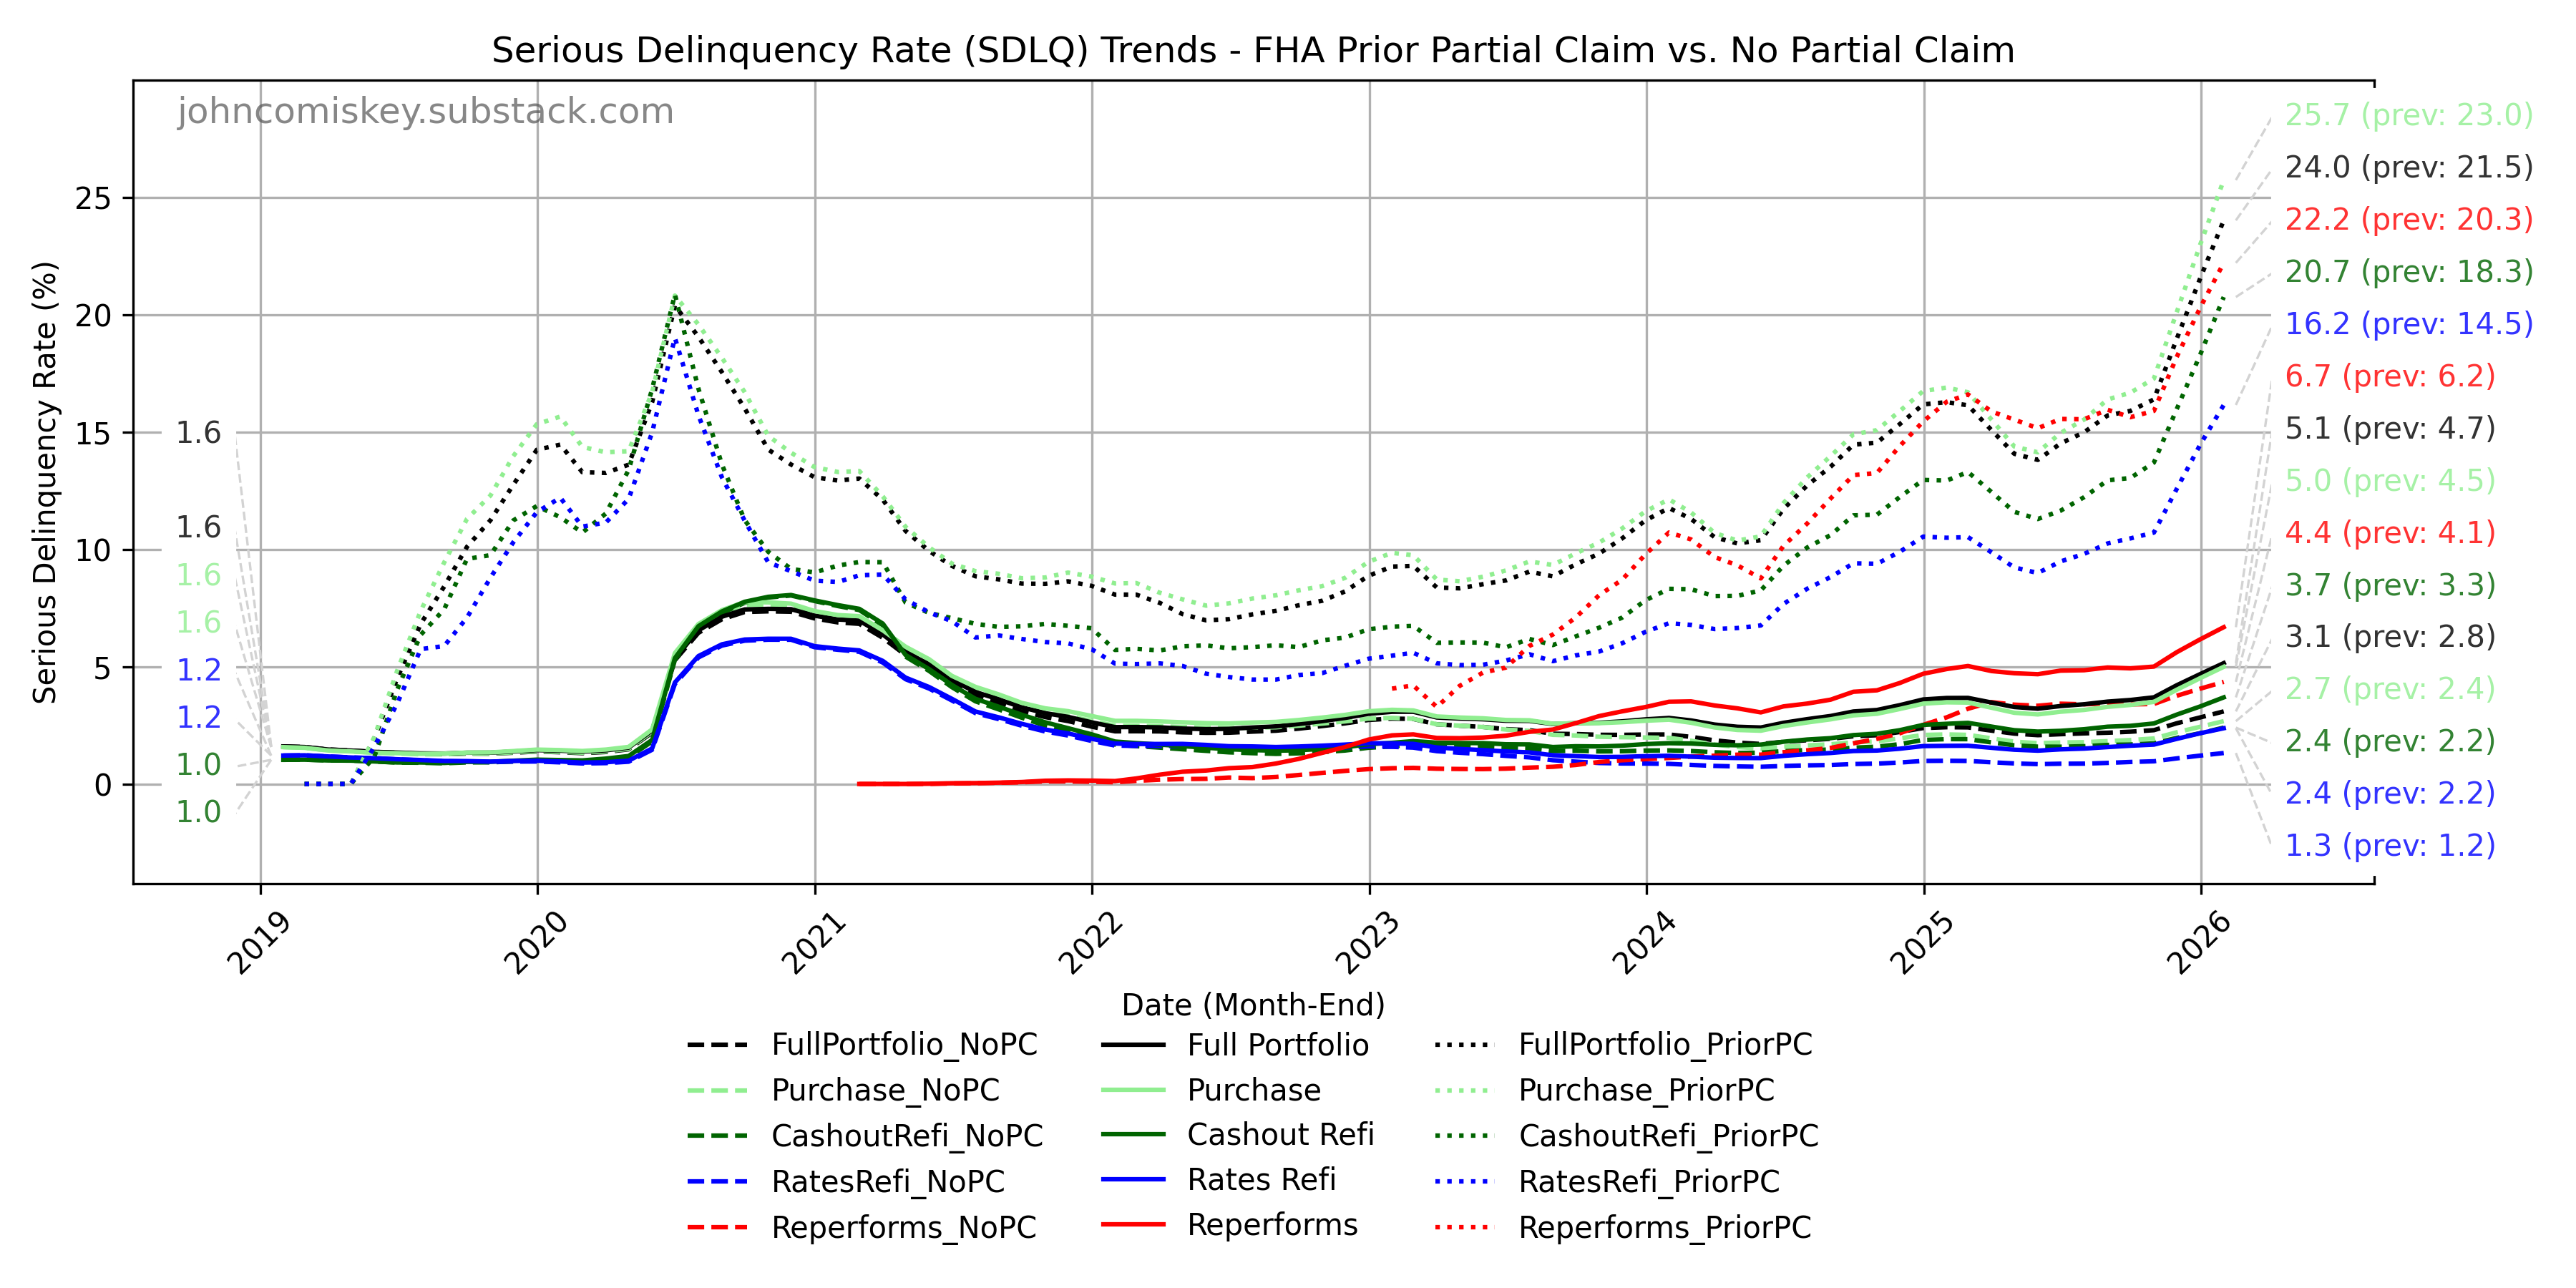
January FHA Claim vs. No Partial Claim charts
Broken record alert…… but once again your friendly monthly reminder. Whether a loan has had a partial claim or not in its history makes it 5-7 times more likely to be DLQ or SDLQ and over the last couple of months this disparity is further widening a bit.
While there are a few subplots to the FHA story, the performance disparity prior partial claim vs. not is the main plot by far.
Pool Removals in January
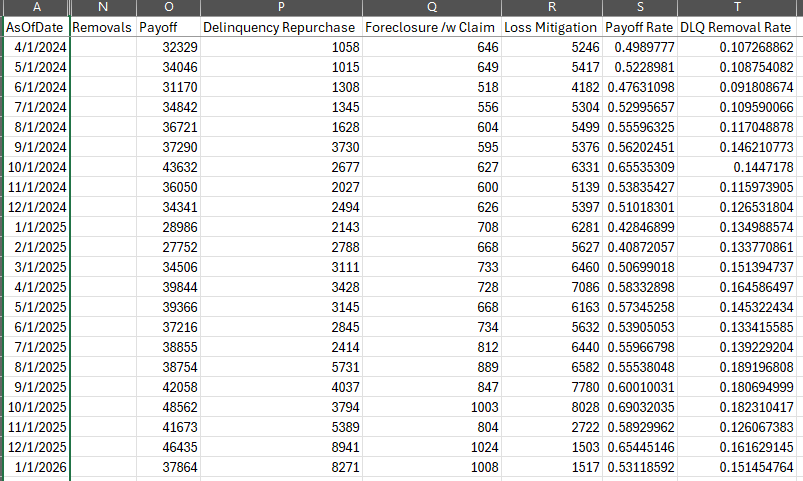
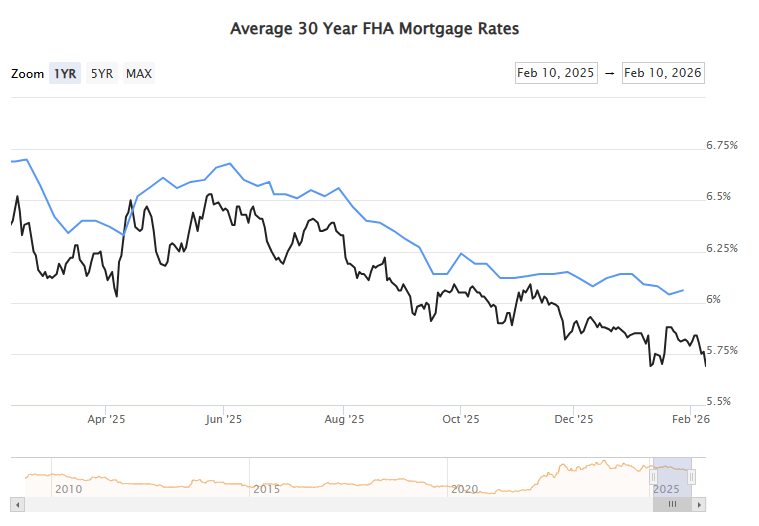
Payoffs dipped which likely partially reflects some seasonality and also the hump in FHA rates in mid November prior to new lows since then. Refinances that rate locked in late November/early December should hit with next months data so I expect a rebound in payoffs then.
Removals due to Foreclosure steady, though still at low levels. This will be the last place we see the impact of the tightened loss mit procedures since foreclosures can take 18 months to make their way through the process in some states.
Delinquency Repurchase pool removals fell a touch but remain very high. I expect these will remain high and actually grow some if prevailing rates dont rise again.
Removals for imminent loss mitigation found their bottom. Next month they should start to rise as loans that completed their 3 trial payments for a modification start being removed from pools to complete the modification. How many? Thats the interesting question. Stay tuned…
Data Behind the Charts
Thanks for your support,
John