

Granular maps of 2024 vintage FHA originations
2024 HMDA data is out now

The loan level HMDA data for 2024 came out last week and after a couple of days of intense processing I now have the FHA MBS data linked to it. In addition to providing me borrower demographic data joined to mortgage performance, it also provides me the census tract where the mortgage is located, the key building block to creating these heat maps.
This post contains a link to two new interactive heat maps 1. A specific heat map of the 2024 FHA originations and 2. An updated heat map of all FHA mortgages outstanding which reflects the now known 2024 data and thus better scaling to the full portfolio.
2024 FHA Originations
The below image shows FHA mortgage originations in the Minneapolis area in 2024. There were not a whole lot of them.
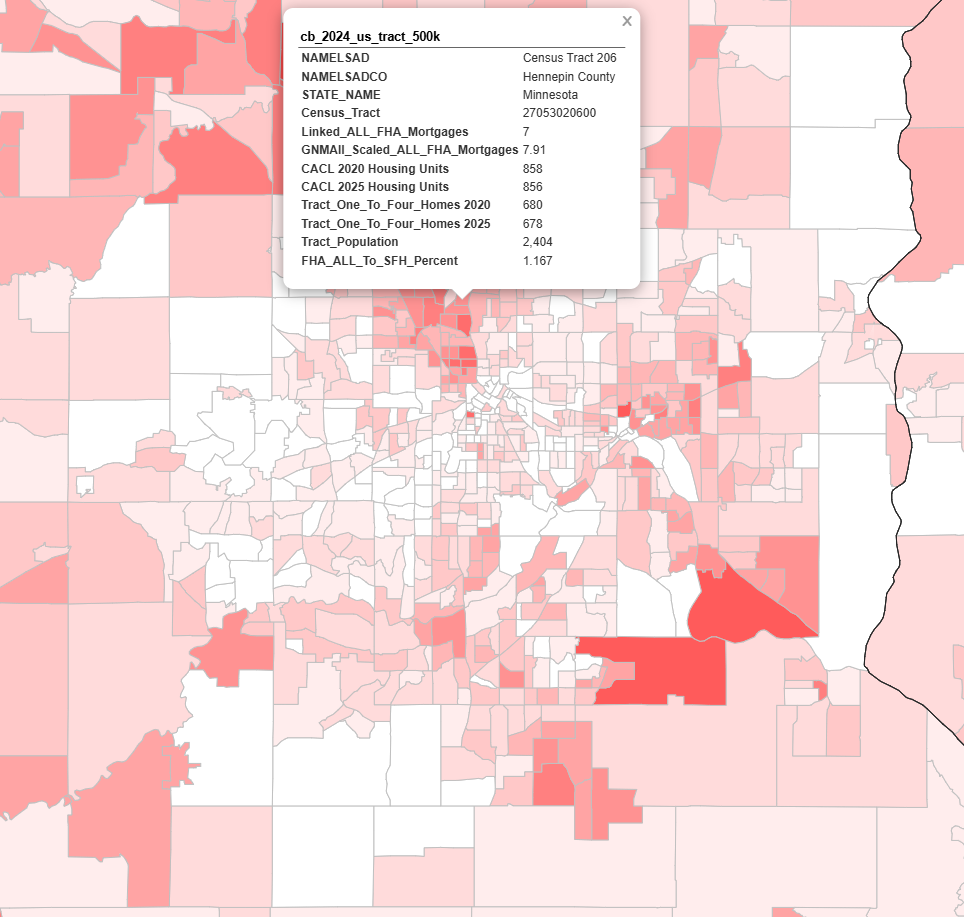
To be sure, FHA mortgages seem to not be super prevalent generally in the Minneapolis area, but relative to the rest of the country, new FHA mortgages in this area seem weak.

You though can see for yourself and dive into any census tract in the United States (except Connecticut, have been focused on linking the new 2024 HMDA data but will get the new CT census tracts imported soon enough)
Notes on the Data
Note that the scaled all FHA mortgages number on the 2024 map is much closer to the actual linked mortgages count for the census tract. My HMDA mapping is able to map ~85-90% of the FHA mortgages for any particular vintage, so the scaling factor for 2024 is around 1.12. Contrast this to the scaling factor of 2 for the updated All FHA mortgages heat map (which was 2.39 in the version I released last week before the 2024 HMDA data was released)
Since HMDA data only dates back to 2018 and since ~37.5% of FHA mortgages outstanding were initially originated prior to 2018, (plus there are a million or so FHAs which are not in GNMA_II pools) I only know with certainty the census tracts for ~50% of the total FHAs outstanding and then scale them assuming similar distribution to census tracts. One bias of that approach though is a likely overstatement in further out from a city core census tract and understatement in further in census tracts. Comparisons of the 2024 map versus the the updated ALL map should reveal where that might be happening.
Next Up
Heat maps of FHA loans with partial claims within the past 2 years
Heat maps of FNMA and FHLMC loans for 2024 and All
Also, the summer QRA is closing in. Ill have my preview soon after the OBBB passes (assuming that doesn’t hit a snag and drag out until August)
I have a number of heat map ideas in the pipeline but would love to hear your suggestions on what heat maps would be valuable to you as well.
John
Link for the Heat Maps.