

December MBS mortgage delinquencies continue their K shape
FNMA/FHLMC doing fine, FHA and VA deteriorating

No paywall post. Paid subscribers received this post on Friday (GNMA files dropped Thursday evening). If you want early access to this data, fairly accurate projections of what the TGA will do for each day two quarters ahead, or just want to support a guy trying to carve out a living publishing independent data-driven macro economic research, please consider subscribing.
(and paid subscribers note there is some new material at the bottom)
Highlight
GNMA released their MBS performance data for December Thursday evening and the recent deterioration trend in FHA and VA delinquencies continued. Technically GSEs showing a teensy bit of deterioration as well but its from so much lower levels (order of magnitude lower for delinquency percentage vs. FHA) that it barely registers. K shaped economy indeed.
Data Context
First some context on this data. Specifically, this data represents the loans that were in GNMA II (vast vast majority of GNMA issuance) pools at the end of month. It includes any new loans added to pools over the month but excludes any loans removed from the pools during the month.
It does not include FHA and VA loans that are not in those pools. So loans that were never securitized like scratch and dents/portfolio held etc. or loans that were removed from pools to attempt modification, or repurchased out of them due to early payment delinquency etc. are not in the data I present. It is very safe to say the delinquency profile of FHA and VA loans not in the MBS pools is considerably worse than those still in pools and it is why the FHA performance trends report (https://www.hud.gov/program_offices/housing/hsgrroom/loanperformance) when it eventually comes out for December will show worse numbers.
What this data does represent is the impulse into delinquency for the FHA and VA portfolios, whether it is weak/strong and shrinking/growing month over month. It also, I believe, acts as a reasonably good proxy for just how stressed the typical borrowers on these loans are. Job prints of +256k add one data point to the story. The FHA and VA delinquency impulse adds another. As does the GSE performance which is an order of magnitude better than FHA. Useful to know them all in my opinion.
Reminder for those who may not know the mortgage industry well:
FHA borrowers - Typically the weakest
VA borrowers - Stronger than FHA, weaker than GSEs
GSE (Fannie Mae/Freddie Mac) - Strongest
Trend in Delinquency Impulse
FHA
Note the steady increases in Total Delinquent and Serious Delinquents. Serious Delinquents up 7.8% month over month and 55% vs. May
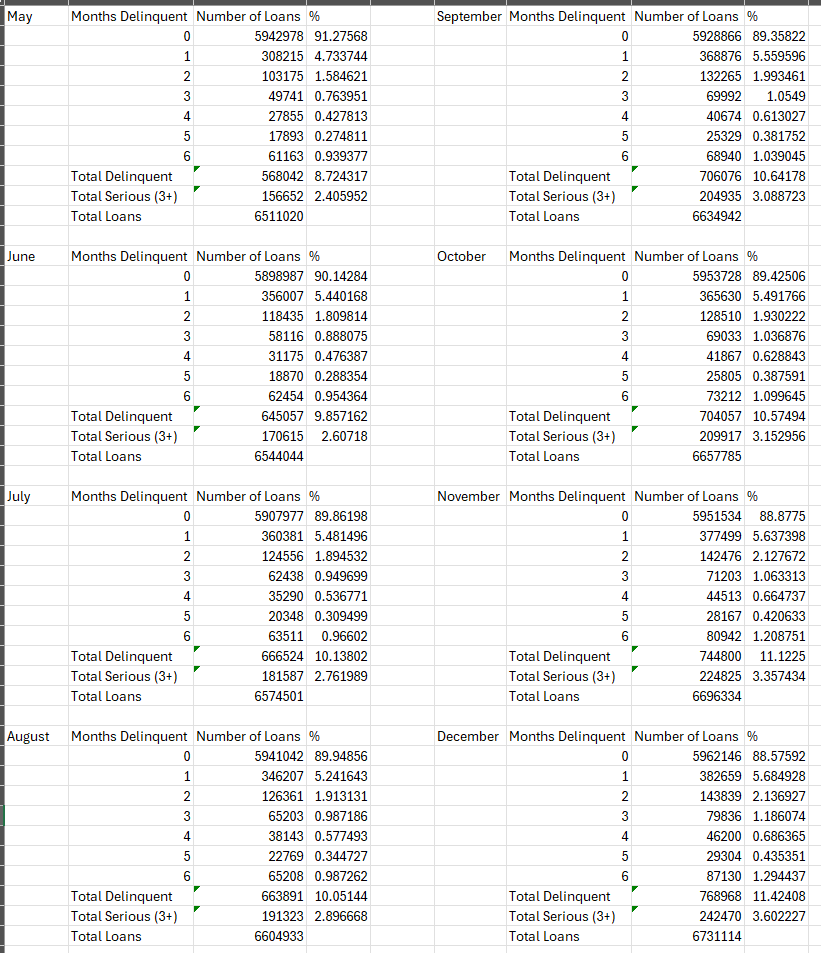
VA
Also steady increases, though at a somewhat lesser rate than FHA. Serious Delinquents up 3.7% month over month and 39% vs. May

GSEs
Unsure if I can share the internals due to terms of use restrictions but the data for FNMA and FHLMC shows a markedly different picture than FHA with Total Delinquents ~1.4% and Total Serious ~0.33% both up since May (~1.05%, ~0.25%) but from very low levels.
Why are FHA borrowers not paying their mortgages?
The FHA performance trends report provides interesting detail, particularly when you compare the most recent report (for October, 2 months behind this data and spanning ~1 million more loans) with the equivalent report five years ago pre-covid. You have to make such a comparison because National Emergency as the Reason for Delinquency makes the more recent data basically useless. There is still ~4% reporting it which should drop soon and distribute into the other buckets but its low enough for decent comparisons now I think.
Comparing the two reports, one thing jumps out. Unemployment as the stated reason for delinquency is approaching double the pre-covid norms. This stands in contrast to the recent jobs numbers and steady growth in social security directed payroll tax receipts (subject of an upcoming post). An interesting discrepancy.
Also - note that That the high No Contact % for October is an effect of being the most recent month and is consistent with historical first month “No Contact” percentages. As those delinquencies continue to age, it will drop and the stated reason will appear. Its hard to say where this will end up vs. pre-covid averages. I suspect a little lower as loss mit operations have improved over time but we shall see.


Conclusion
Whatever your macro take might be if it isnt accounting for the growing distress in FHA and to a lesser degree VA mortgages right now (but barely if really at all happening to GSE mortgages), then it probably ought to be. I will continue to provide the data as it rolls in (paid subs of course getting an earlier look).
Bonus April Tax Receipt Content
The LA fires will certainly have some effect on the collection of April Tax receipts, but that effect will be considerably less than the California floods of 2023. As it stands now only LA County has the extension until October. LA County has ~9.6 million residents. A huge population for sure but only 1/3 of the 44 counties (which included LA) with ~30 million residents eligible for the 2023 extension to October.
Additionally, LA County is not particularly wealthy (at least by California terms) ranking 18th in CA (86th nationally) per this report: https://smartasset.com/investing/asset-allocation-calculator#california/overallWealth-0
The wealthiest counties in California are clustered near Silicon Valley. Notably these were all included in the 2023 extensions.
Assuming this stays just LA County I estimate it will likely have 1/4 the impact of 2023. Not Nothing for sure but not a 2023 repeat.
As always thanks for reading.
John
Great research.